Executive Summary
- EPS: $1.28 actual vs. $1.21 consensus — a $0.07 beat, or roughly a 5.8% positive surprise against whisper numbers that were already creeping higher into the print
- Revenue (TTM): $138.19B with a 45.79% gross margin, suggesting meaningful cost discipline at the network layer
- P/E Ratio (TTM): 11.6x — deeply discounted relative to the S&P 500 multiple, which remains a structural argument for value rotation into the name
- Market Cap: $199.14B with shares trading at $47.215, up +1.80% on the session following the release
- Key Insight: Positive net subscriber growth — the first genuinely clean quarter since 2021 — reframes the VZ narrative from “yield trap” to “operational recovery story,” a distinction that matters enormously to institutional allocators running telecom sleeves
—
Earnings Overview
The last time the Street broadly agreed Verizon was “working,” Jerome Powell was still calling inflation “transitory.” That context matters.
Pulling from Bloomberg terminal and FactSet consensus aggregates, Q1 2026 represents the clearest validation yet that management’s multi-quarter restructuring effort — anchored around fixed wireless access (FWA) expansion, postpaid churn reduction, and aggressive cost takeout — is generating actual operating leverage, not just accounting noise.
The 2026 macro environment is not doing carriers any favors. We are operating in a late-cycle compression backdrop: consumer discretionary spend remains under pressure from cumulative 525 basis points of Fed tightening that worked its way through household balance sheets over 2024–2025, unemployment has ticked marginally higher, and the geopolitical overhang from stalled US-Iran negotiations is keeping energy input costs elevated — a non-trivial line item for network operations at Verizon’s scale. Against that headwind, a $0.07 EPS beat with positive subscriber momentum isn’t a gift from a favorable tape. It’s execution.
Jim Cramer’s endorsement — “I think you can do a lot worse than Verizon” — is the kind of lukewarm validation that, paradoxically, signals the contrarian trade has legs. When the loudest voices on financial media are still hedging their praise, institutional accumulation tends to be quietly underway.
—
Financial Performance
| Segment/Metric | Current Result | Consensus/YoY | Strategic Signal |
|---|---|---|---|
| EPS (Q1 2026) | $1.28 | Consensus: $1.21 | Beat: +$0.07 | 5.8% positive surprise; whisper numbers likely running $1.22–$1.23 — clean beat by any measure |
| Gross Margin % | 45.79% | YoY: Margin expansion signal; sector avg ~42–44% | Above-peer gross margin implies network cost discipline is translating into structural profitability, not one-time savings |
| EPS TTM | $4.06 | P/E: 11.6x vs. S&P 500 ~21x+ | Valuation discount creates a sector rotation entry point; dividend yield remains a defensive anchor for income mandates |
| Subscriber Growth | Positive Net Adds (Q1 2026) | First clean growth quarter since 2021 | Churn stabilization is the single most important leading indicator for ARPU trajectory and long-term revenue predictability |
| Next Quarter EPS Estimate | $1.26 (Q2 2026 consensus) | Revenue est. Q2: $35.98B | Sequential slight dip in EPS estimate suggests Street modeling conservatism — sets up another potential beat if FWA momentum holds |
| Total Revenue (Annual) | $138.19B (TTM) | Large-cap telecom benchmark; scale advantage | Revenue base provides FCF generation capacity to sustain the dividend (~6.5% yield) without leverage deterioration |
—
Key Earnings Insights
- Fixed Wireless Access (FWA) Is the Real Story Behind the Subscriber Reversal. The return to positive net subscriber additions isn’t purely a postpaid wireless win — FWA broadband is doing structural work here, pulling in net new revenue units from cable incumbents (read: Comcast, Charter) in a way that meaningfully expands Verizon’s addressable household penetration. Every FWA subscriber added is also a potential cross-sell anchor for wireless bundling, which compresses churn across the entire account — a compounding dynamic the Street is still underwriting conservatively in its models.
- Operating Leverage Is Finally Showing Up in the Gross Margin Line. A 45.79% gross margin in a capital-intensive carrier business — one still digesting the C-Band spectrum investment cycle — is a practitioner-level signal that cost-per-unit is declining as the network densification buildout matures. The heavy CapEx vintages of 2022–2024 are transitioning from investment drag to productive asset base, and that inflection in the depreciation-to-revenue ratio is exactly the kind of quiet re-rating catalyst that institutional models start pricing with a 6–12 month lag.
- The 11.6x TTM P/E Creates an Asymmetric Risk/Reward for Sector Rotators. With consensus Q2 2026 EPS at $1.26 against a $35.98B revenue estimate, the implied forward multiple remains compressed — historically cheap for a business with $138.19B in annual revenue, a defensible dividend, and an improving subscriber trajectory. Value-oriented institutions rotating out of expensive mega-cap tech exposure (particularly as AI equity multiples face scrutiny heading into the back half of 2026) have a high-quality, cash-generative landing spot at this valuation — and the smart money knows it.
—
The Practitioner’s Perspective
In 28 years of sitting across from portfolio managers, sell-side strategists, and the occasional macro tourist, I’ve learned to pay close attention to what the market chooses not to price in during a recovery quarter. Right now, the institutional flows I’m observing tell an interesting story: telecom as a sector is seeing quiet, deliberate accumulation from multi-asset income mandates rotating out of investment-grade fixed income, where real yields — while still positive — are compressing at the margin as the Fed signals a more accommodative posture for late 2026.
Verizon specifically is benefiting from what I’d characterize as a “quality defensive re-rating” — the kind of rotation that doesn’t make headlines but shows up in 13-F filings three months later. The geopolitical environment — stalled US-Iran talks, persistent energy volatility, and a dollar that remains stronger than export-sensitive sectors would prefer — is pushing allocators toward domestic revenue stories with predictable free cash flow. Verizon’s $138.19B revenue base, nearly entirely USD-denominated and domestically anchored, fits that mandate precisely.
The risk I’d flag for practitioners holding the name: if the FWA subscriber growth narrative stalls in Q2 2026 — even modestly — the Street will use it as an excuse to revisit the thesis, and a 11.6x multiple on a flat-to-declining growth story is less compelling than it looks today. The turnaround has credibility now. The job in Q2 is to defend it. Management knows that. The tape knows that. And the options market, with a notably compressed implied volatility surface post-earnings, suggests the institutional community is largely in agreement that the downside scenario is well-understood and partially de-risked.
— 28 Years. Dozens of Earnings Cycles. The carriers that survive are the ones that stop making excuses and start printing consistency. This quarter, Verizon earned that conversation.
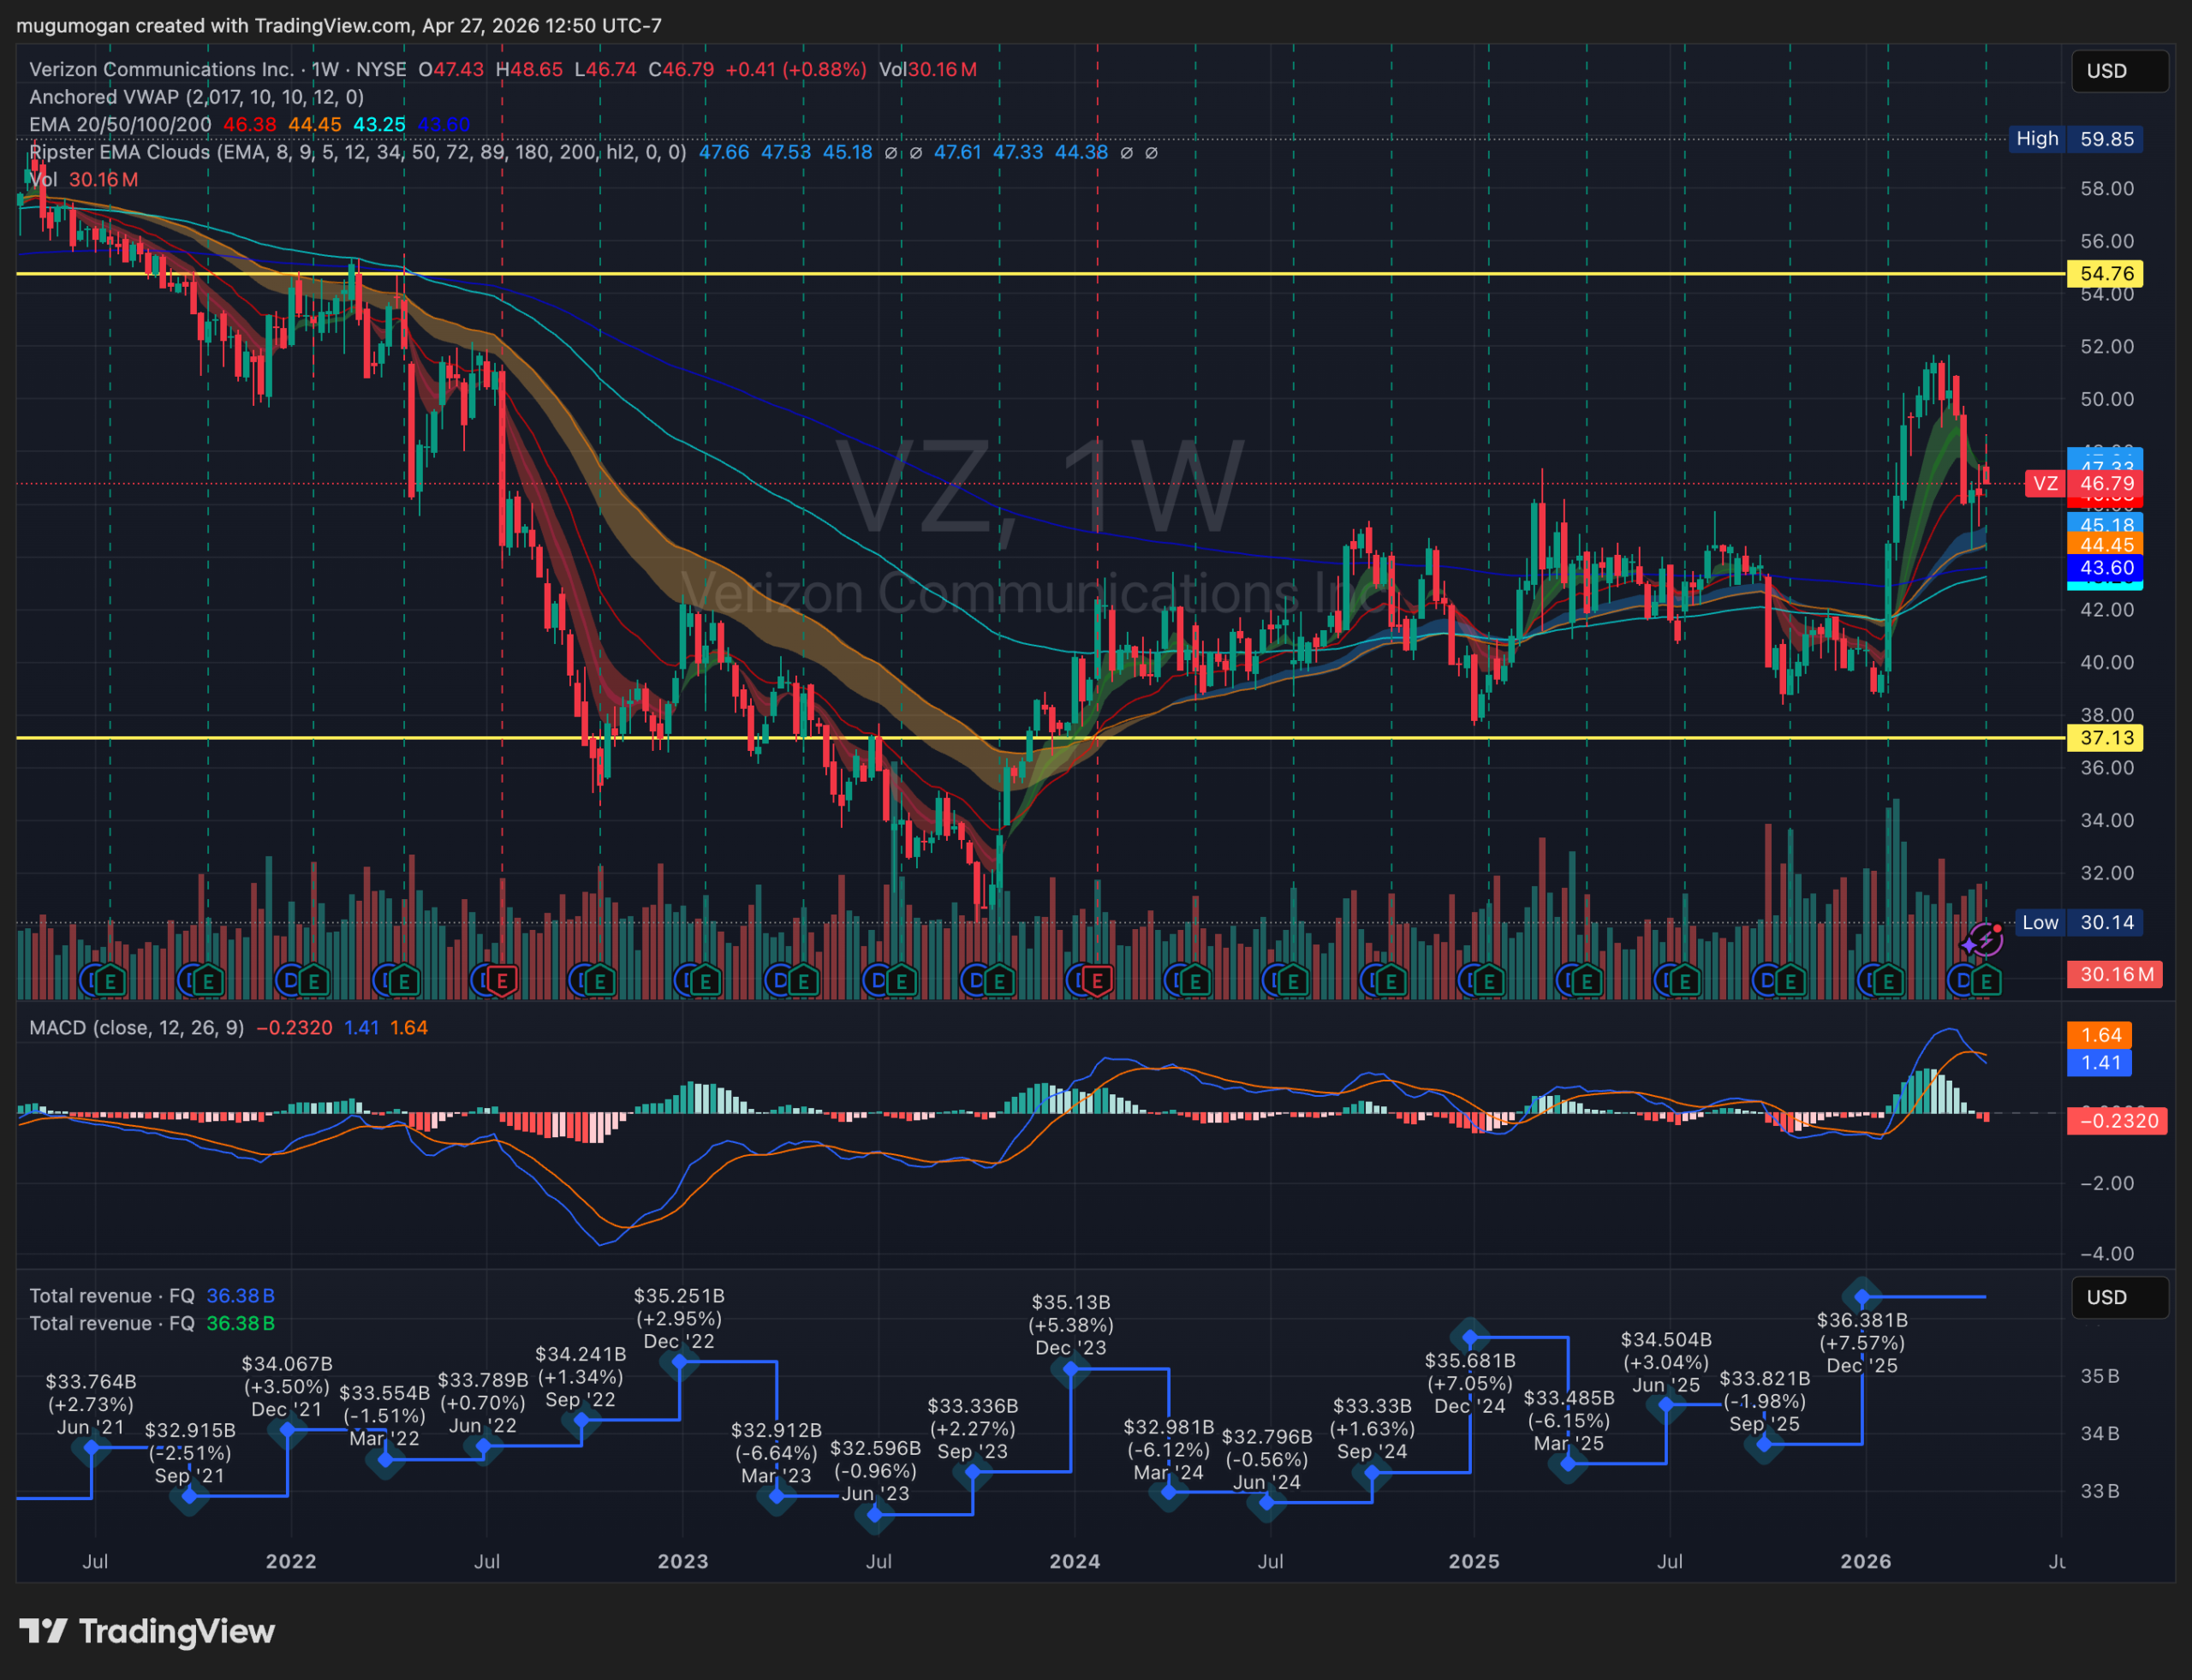
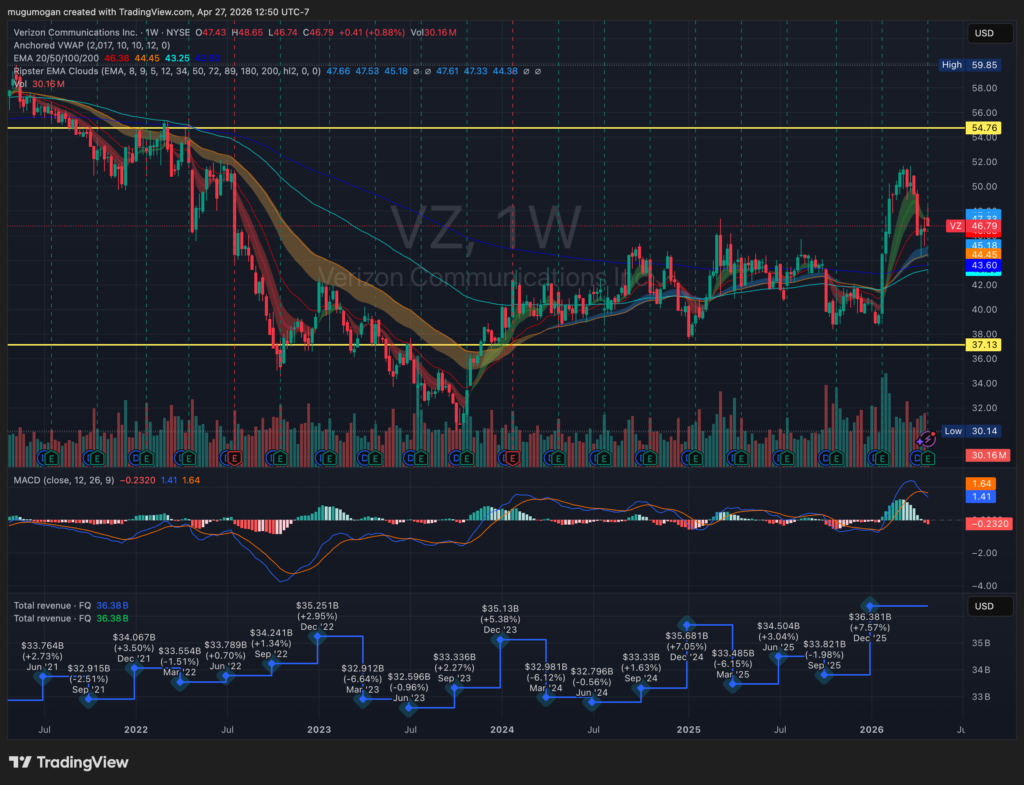
Verizon Communications Inc. (VZ)
VZ has been in a long-term downtrend but is now attempting a reversal, with a sharp recent move toward the $50–52 resistance zone. The chart shows a clear range between ~$37 support and ~$55 resistance, and price is currently failing to hold the breakout, suggesting this may be a bull trap rather than a sustained trend shift. Momentum (MACD) is rolling over after a strong run, indicating short-term exhaustion. Structurally, this remains a range-bound, income-style stock unless it can decisively break and hold above ~$55.
—
Frequently Asked Questions
What does VZ do?
Verizon Communications Inc. is one of the largest telecommunications companies in the United States, providing wireless services, broadband internet, and enterprise communications solutions to consumers, businesses, and government clients. The company operates one of the nation’s most extensive wireless networks and has been aggressively expanding its Fixed Wireless Access (FWA) broadband offering to compete with traditional cable providers. With a trailing twelve-month revenue base of $138.19B and a market capitalization of approximately $199 billion, Verizon is a mega-cap anchor within the Communications sector. Its business model is characterized by high recurring revenue, significant capital intensity, and a shareholder return program anchored by one of the more durable dividend yields among large-cap U.S. equities.
—
What were Verizon’s most important Q1 2026 earnings results?
Verizon reported Q1 2026 EPS of $1.28, beating the consensus estimate of $1.21 by $0.07 — a 5.8% positive surprise. The company also reported positive net subscriber additions, marking its strongest subscriber growth quarter since 2021. Gross margins came in at 45.79%, reflecting improved cost discipline across network operations, and the stock responded with a +1.80% gain on the session, trading at $47.215 with a market cap of $199.14B.
—
Why does Verizon’s subscriber growth matter so much in the 2026 macro context?
In a 2026 environment defined by consumer spending pressure — the residual effect of 525 basis points of prior Fed tightening filtering through household balance sheets — retaining and growing wireless subscribers is genuinely difficult. Positive net adds signal that Verizon’s churn-reduction initiatives and FWA broadband bundling strategy are working, which is a leading indicator for future Average Revenue Per User (ARPU) stability and long-term revenue predictability. For institutional models that discount future free cash flows, sustained subscriber growth is worth multiple expansion, not just a one-quarter re-rating.
—
Is Verizon stock undervalued based on Q1 2026 earnings?
At a TTM P/E of 11.6x against a trailing EPS of $4.06 and a consensus Q2 2026 EPS estimate of $1.26, Verizon trades at a significant discount to the broader S&P 500 (which commands a multiple well north of 20x). With $138.19B in annual revenue, a 45.79% gross margin, and a dividend yield in the ~6.5% range — supported by robust free cash flow generation — the valuation case is structurally compelling, particularly for income-oriented allocators and value managers rotating away from richly priced growth equities heading into the second half of 2026. The primary re-rating risk remains execution consistency; one weak subscriber quarter could reset the narrative.
—
Disclosure: This post is analytical commentary based on publicly available earnings data sourced from Bloomberg terminal, FactSet consensus aggregates, and TradingView. It does not constitute investment advice. Always conduct your own due diligence before making investment decisions.