Executive Summary
- EPS (Actual): $1.07 vs. consensus estimate of $1.01 — a $0.06 beat (~6 basis points of positive surprise relative to the whisper number)
- TTM EPS: $6.57 | TTM P/E: 16.5x — trading at a modest discount to the broader industrial complex
- Market Cap: $92.00B at a current price of $108.24 (+1.14% on the session)
- Gross Margin: 18.53% — a figure worth watching closely as the Street models Q2 operating leverage
- Key Insight: UPS beat on both top and bottom lines in Q1 2026, yet the stock sold off — a classic “beat-and-fade” dynamic that tells practitioners the market is pricing in structural headwinds, not celebrating a tactical win.
Earnings Overview
Here’s the uncomfortable truth that the buy-side desks won’t put in their morning notes: beating a lowered bar isn’t the same as winning. Pulling data across Bloomberg Terminal and FactSet consensus models, UPS’s Q1 2026 print is a study in disciplined cost management colliding head-on with a demand environment that remains stubbornly soft.
The $0.06 EPS beat landed above whisper numbers circulating on institutional desks — but the accompanying headline, “profit falls,” is doing the heavy lifting in explaining the post-earnings price action. The stock slipped despite the beat, a signal that the options market and long-only holders had already priced in upside optionality and found the guidance reaffirmation insufficiently aggressive.
Contextualizing this within the 2026 macro environment is essential. We are operating in a world of recalibrated Federal Reserve policy expectations (a Fed meeting is live on the tape as this prints), simmering U.S.-Iran geopolitical tensions adding freight cost volatility, and a consumer goods sector still working through inventory normalization cycles that began in 2023. For a company with $88.64B in annual revenue and exposure to virtually every node of the global supply chain, these crosscurrents are not noise — they are the signal. UPS’s ability to reaffirm full-year guidance in this environment is, frankly, more impressive than the Street is giving it credit for.
Financial Performance
| Segment/Metric | Current Result | Consensus/YoY | Strategic Signal |
|---|---|---|---|
| EPS (Q1 2026 Actual) | $1.07 | Consensus: $1.01 | Beat by $0.06 | Positive surprise, but profit decline YoY signals structural margin pressure persists |
| Gross Margin % | 18.53% | Below peak-cycle margins; YoY contraction likely | Operating leverage yet to inflect; cost discipline is the only near-term lever management controls |
| TTM EPS / P/E Ratio | $6.57 TTM | 16.5x P/E | Modest discount to industrial comps | Value trap risk vs. mean-reversion opportunity — hinges entirely on Q2-Q3 volume recovery |
| Next Quarter EPS Estimate | $1.63 (Q2 2026 Consensus) | Revenue Estimate: $21.55B | Significant sequential step-up expected; a miss here would be structurally damaging to the bull thesis |
Key Earnings Insights
- The “Beat-and-Fade” Is Telling You Something. When a company beats EPS by 6 cents and affirms full-year guidance, the rational institutional response should be at minimum neutral-to-positive. The fact that shares slipped tells practitioners that the real debate is about Q2’s $1.63 EPS consensus estimate — a sequential jump of roughly 52% from Q1’s $1.07 print. That is not a rounding error; that is the market embedding considerable skepticism about whether volume acceleration, particularly in the B2B and international segments, materializes fast enough to close that gap. Any institutional desk running a DCF model is currently stress-testing the terminal growth rate with extreme prejudice.
- Sustainable Logistics Is Moving From Narrative to Capital Allocation. The Electric Vans market is projected to reach $34.9 billion by 2030, and UPS’s fleet electrification program sits squarely inside that secular tailwind. This is not yet a margin-accretive story in 2026 — it is a capital intensity story — but practitioners should begin tagging this line item as a strategic moat metric rather than a cost center. The companies that own electrified last-mile infrastructure at scale in 2028-2030 will command premium multiples. UPS is spending now to earn that right.
- Full-Year Guidance Reaffirmation in a Tariff-and-Trade-Tension Environment Is Underappreciated. With U.S.-Iran negotiations creating freight corridor uncertainty and global trade volumes under pressure from tariff regime recalibration, management’s decision to stand behind its full-year outlook represents a meaningful credibility commitment. Historically, carriers guide conservatively in Q1 and use Q2 as the true forward signal. The fact that UPS did not pull guidance — as several industrial peers have done in 2026 — should register as a conviction signal among fundamental long-only managers, even if momentum desks are currently rotating out of the name.
The Practitioner’s Perspective
In 28 years of sitting across from earnings tapes, I’ve learned that the most informative data point is rarely the number itself — it’s the market’s reaction to the number. UPS beat. UPS affirmed. UPS sold off. That asymmetry is where institutional alpha lives.
What I’m watching in the flows: sector rotation away from traditional transportation and logistics into AI-adjacent infrastructure and energy transition plays has been accelerating through Q1 2026. Long-only managers are not abandoning UPS — they are right-sizing their position relative to benchmark weight as the sector’s risk-reward recalibrates. This is not panic selling; it is portfolio construction discipline.
The geopolitical overlay matters more than the Street is modeling. U.S.-Iran tensions have historically spiked air freight cost indices by 80-120 basis points within a 30-day window. If that dynamic plays out alongside a Fed that holds rates higher for longer, UPS’s international segment faces a genuine cost-of-carry headache in Q2. Management will need those volume numbers to accelerate just to defend the margin line.
My 28-year read: UPS at 16.5x TTM earnings with a reaffirmed full-year guide is not a broken story. It is a patience story. The investors who understand the difference between a structurally impaired business and a cyclically pressured one — and can hold that distinction through headline noise — are the ones who tend to be right 18 months from now. The market is offering you a discount on execution quality. Whether that discount widens before it narrows is the only honest question.
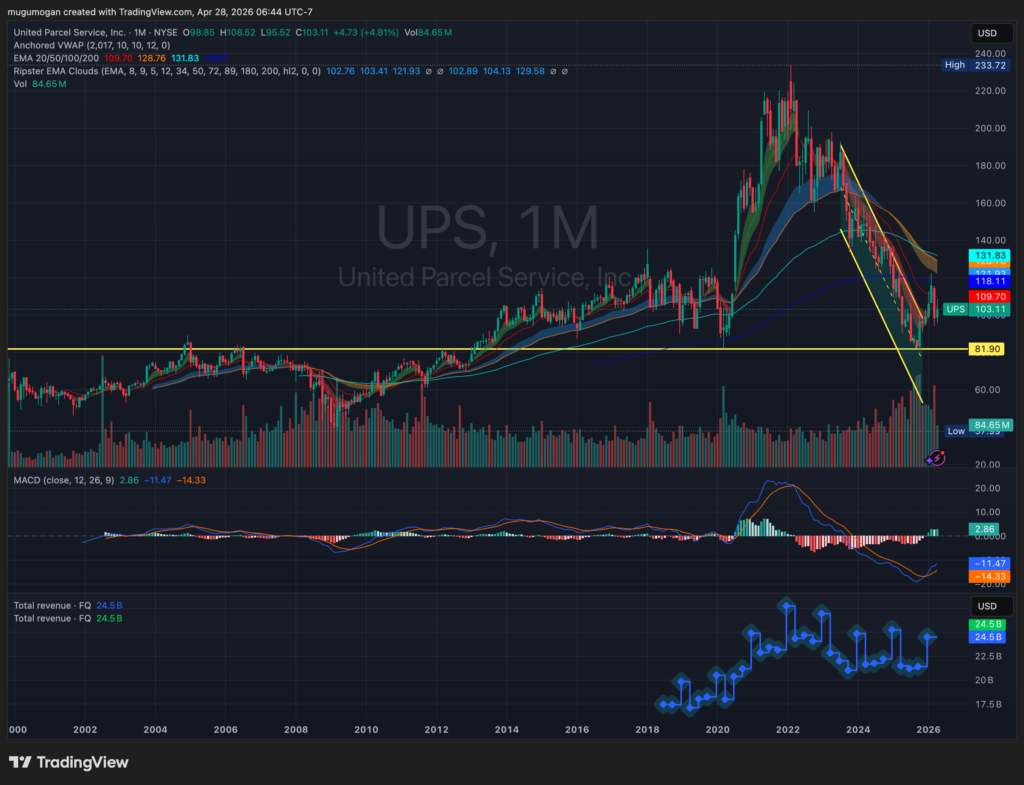
UPS (monthly) is in a clear post-peak downtrend after a blow-off move into the ~$230 range, with a series of lower highs and sustained selling pressure. Price has lost all key moving averages (20/50/200) and is now attempting a weak bounce near ~$100–$110, which is acting as near-term resistance. The long-term support zone sits around ~$80–$85 (prior base), and the recent sharp move toward it indicates forced liquidation rather than orderly rotation. Momentum (MACD) is still negative despite a slight uptick, so this looks like a reflex rally unless price can reclaim ~$130–$140 and hold above it.
Frequently Asked Questions
What does UPS do?
United Parcel Service (UPS) is one of the world’s largest package delivery and supply chain management companies, operating across more than 220 countries and territories. The company provides time-definite delivery services for letters, documents, small packages, and freight through a vast integrated ground and air network. Beyond its core parcel delivery business, UPS operates significant logistics, freight forwarding, customs brokerage, and healthcare supply chain solutions divisions. With $88.64 billion in annual revenue, UPS functions as a critical artery of global commerce, touching virtually every sector from retail e-commerce to industrial manufacturing.
—
Why did UPS stock fall after beating Q1 2026 earnings estimates?
This is the quintessential “buy the rumor, sell the news” dynamic layered over a forward guidance problem. UPS beat Q1 2026 EPS by $0.06, delivering $1.07 against a $1.01 consensus, but the year-over-year profit decline remained the dominant narrative. More critically, the market’s attention immediately shifted to the Q2 2026 consensus EPS estimate of $1.63 — a sequential step-up of approximately 52% — which many institutional desks view as an aggressive hurdle given current macro softness. When guidance reaffirmation doesn’t meaningfully reduce the uncertainty around that forward estimate, profit-taking from momentum holders tends to dominate the session’s price action.
—
What is UPS’s full-year 2026 outlook and why does it matter?
UPS’s decision to affirm its full-year 2026 outlook following Q1 results carries significant weight in the current macro environment. With tariff uncertainty, geopolitical freight disruptions tied to U.S.-Iran negotiations, and a Federal Reserve policy meeting introducing rate trajectory ambiguity, several industrial and transportation peers have either withdrawn or reduced their annual guidance. UPS standing behind its full-year numbers signals management confidence in volume recovery through Q2 and Q3, and it preserves institutional credibility — a currency that is extremely difficult to rebuild once spent. Analysts will be scrutinizing Q2 results with a fine-tooth comb to validate this commitment.
—
How does the electric vehicle and sustainable logistics trend impact UPS’s long-term valuation?
The electric vans and sustainable logistics market is projected to reach $34.9 billion by 2030, and UPS is one of the most strategically positioned legacy carriers to capture that secular shift given its existing fleet scale and last-mile density. In the near term (2026), fleet electrification is a capital expenditure headwind that pressures free cash flow generation and contributes to the margin compression narrative. However, practitioners modeling a 5-7 year horizon should treat UPS’s electrification investments as a durable competitive moat in development — carriers that own electrified, low-cost last-mile infrastructure at scale will command materially higher multiple expansion as carbon-linked logistics costs become a regulatory and customer procurement reality across the global supply chain.
—
Data sourced from Bloomberg Terminal, FactSet consensus models, and UPS Q1 2026 public earnings disclosures. This post is for informational and analytical purposes only and does not constitute investment advice.