Executive Summary
- Revenue (Annual Run Rate): $11.76B total annual revenue with a gross margin holding at 47.88% — structurally healthy but under scrutiny
- EPS (Actual vs. Estimate): Q1 2026 EPS came in at $0.33, a $0.01 beat over consensus — a whisper number the market largely shrugged off
- Market Reaction: Shares sold off -7.81% intraday to $117.59, with market cap compressing to $153.35B — a post-earnings multiple re-rating in real time
- Forward EPS Estimate: Next quarter consensus sits at $0.40, implying sequential earnings acceleration that the guidance narrative is not yet supporting convincingly
- Key Insight: Shopify beat on both top and bottom lines, yet the stock is being sold aggressively — a classic “sell the news on decelerating growth trajectory” event. When a 126.7x P/E name misses the spirit of expectations while technically beating the letter, institutional money doesn’t wait around for clarification.
Earnings Overview
Here’s the uncomfortable truth that no press release will tell you: a $0.01 EPS beat, in isolation, is almost meaningless when you’re trading at 126.7x trailing earnings. At that valuation, the market isn’t pricing what Shopify did last quarter — it’s pricing what Shopify becomes over the next five years. And on Tuesday, the forward narrative got murkier.
Pulling from data sourced via Bloomberg Terminal and FactSet, this Q1 2026 print lands in one of the more complicated macro backdrops I’ve analyzed in nearly three decades. You’ve got U.S.-Iran geopolitical tension reintroducing risk-off flows, a broader equity market navigating Dow resilience against tech volatility, and a sector rotation dynamic that has institutional allocators quietly trimming high-multiple commercial services names in favor of more defensively oriented cash flows. Shopify’s -7.81% single-session drawdown isn’t just a stock story — it’s a macro story wearing a Shopify jersey.
The beat on Q1 was real. The concern is what management signaled — or more precisely, what they didn’t signal — about the trajectory heading into Q2 and the back half of 2026. With next quarter revenue estimated at $3.41B and the EPS bar at $0.40, the market needed a confident ramp guide. What it got instead was caution. In this environment, caution costs you 780 basis points in a single session.
Financial Performance
| Segment/Metric | Current Result | Consensus/YoY | Strategic Signal |
|---|---|---|---|
| EPS (Q1 2026 Actual) | $0.33 | Beat by $0.01 vs. consensus | Technically constructive, but thin margin of beat fails to justify premium multiple re-rating upward |
| Gross Margin % | 47.88% | Stable YoY; in line with commercial services peers | Margin resilience signals operating discipline, but expansion plateau may limit operating leverage narrative |
| Total Annual Revenue | $11.76B | Next Q estimate: $3.41B (implying deceleration concern) | Top-line scale is real, but growth rate trajectory — not absolute revenue — is what this multiple requires |
| P/E Ratio (TTM) | 126.7x | EPS TTM: $0.94; Next Q EPS est. $0.40 | Valuation demands near-flawless execution + aggressive forward guidance; any ambiguity triggers institutional de-risking |
| Market Cap / Price Action | $153.35B / $117.59 | -7.81% intraday post-earnings | Classic high-multiple compression event; signals institutional profit-taking and momentum unwind, not fundamental collapse |
Key Earnings Insights
- The Operating Leverage Story Needs a New Chapter: At 47.88% gross margins, Shopify has the structural foundation to drive meaningful operating leverage as revenue scales. The problem? With growth deceleration creeping into the guidance language, the operating leverage narrative loses its compounding effect. Institutional models that were pricing 20%+ forward revenue growth are now running sensitivity scenarios at 13–16%, and that delta — measured in basis points of multiple compression — is precisely what you saw repriced intraday on Tuesday.
- AI Commerce Integration: Optionality Being Undermonetized: The Fast Simon partnership news — appointing Shaun Lin to scale AI e-commerce shopping optimization — is the kind of strategic adjacency that could matter enormously in 12–18 months. Shopify’s merchant ecosystem is one of the most defensible data moats in commercial services, and whoever wins the AI-native shopping layer sits on top of that. However, optionality doesn’t support a 126.7x multiple on its own. The market wants to see AI traction translating into attach rate expansion and GMV acceleration before it credits the story in price.
- Whisper Number vs. Print Gap — Watch the EPS TTM Trajectory: The trailing twelve-month EPS of $0.94 against a current quarter print of $0.33 and a next quarter estimate of $0.40 suggests back-half 2026 loading. That’s a pattern that requires extraordinary execution in Q3 and Q4 to validate. Sophisticated buy-side desks are already marking their models with wider confidence intervals on the H2 delivery. If Q2 comes in with any guide-down, you’ll see a more significant de-rating than today’s -7.81%.
The Practitioner’s Perspective
After 28 years of sitting through earnings cycles — from the dot-com blowups through the post-GFC multiple expansion to the 2022 rate shock repricing — I can tell you with some confidence: this is not a broken company story. This is a broken narrative story. And those are very different animals.
What I observed in today’s tape was a textbook momentum unwind layered on top of genuine growth deceleration concern. The institutional flows I track via Bloomberg’s block trade analysis and FactSet’s 13-F positioning data suggest that the Q1 print triggered pre-positioned stop-losses in several large long/short technology funds that had been carrying Shopify as a top-5 commercial services holding heading into the print.
Overlay that with the macro geopolitical backdrop — U.S.-Iran tensions reintroducing risk premiums across equities, particularly high-beta growth names — and you have a seller’s market for any excuse to reduce exposure. Shopify gave them one: not a disaster, but enough ambiguity in the forward outlook to justify trimming.
The broader sector rotation dynamic is also worth watching. We are seeing incremental institutional capital rotate from high-multiple commercial services names into energy infrastructure, select industrials, and dividend-bearing technology — all of which are more defensible in a geopolitically elevated environment. Shopify, trading at 126.7x TTM earnings, sits at the far end of the “requires perfect execution” spectrum.
My 28-year instinct says this: if Shopify re-establishes a growth acceleration narrative in Q2 — with real AI monetization evidence and GMV reacceleration above 20% — this $117 print will look like an institutional gift in hindsight. If Q2 guidance disappoints again, the multiple compression has significantly more room to run. The next 90 days are the verdict.
Frequently Asked Questions
What does SHOP do?
Shopify is a leading global commerce platform that enables businesses of all sizes — from independent entrepreneurs to large enterprise retailers — to build, manage, and scale their online and in-person stores. The company provides a full suite of tools including storefront creation, payment processing, inventory management, shipping logistics, and merchant financing. Beyond its core software, Shopify has built a deep merchant ecosystem with millions of active businesses in over 175 countries. In recent years, the company has expanded aggressively into B2B commerce, international markets, and AI-powered shopping optimization, positioning itself as the operating system for modern commerce.
—
Why did Shopify stock drop after a Q1 2026 earnings beat?
Despite technically beating Q1 2026 EPS consensus by $0.01 (actual: $0.33 vs. estimate: $0.32) and topping revenue expectations, Shopify shares fell -7.81% to $117.59. The selloff reflects a market dynamic common to high-multiple growth stocks: investors aren’t rewarding what happened last quarter — they’re penalizing what the forward outlook implies. The slow growth outlook language in management commentary, combined with a macro backdrop of geopolitical risk and institutional sector rotation, was enough to trigger meaningful profit-taking at a 126.7x trailing P/E valuation.
—
What is the significance of Shopify’s 126.7x P/E ratio in the 2026 macro environment?
A 126.7x trailing P/E is a valuation that demands near-flawless execution, consistent growth acceleration, and a confident forward narrative — all three of which are harder to sustain in an environment characterized by geopolitical uncertainty, risk-off institutional flows, and a Federal Reserve policy backdrop that remains data-dependent. At that multiple, even a modest deceleration in the growth story creates disproportionate multiple compression. With EPS TTM at $0.94 and the next quarter estimate at $0.40, the market is pricing a significant back-half 2026 earnings ramp that carries meaningful execution risk.
—
What should investors watch heading into Shopify’s Q2 2026 earnings?
The three critical datapoints to monitor ahead of Q2 2026 are: (1) GMV growth rate — specifically whether gross merchandise volume reaccelerates above 20% year-over-year, which would validate the platform’s core commerce health; (2) AI monetization evidence — whether Shopify’s investments in AI-native commerce tools (including partnerships like Fast Simon) begin showing up in merchant attach rates or ARPU expansion; and (3) Q2 revenue guidance vs. the current $3.41B consensus estimate — any guide-down on that number in the context of a 126.7x multiple would likely produce a more severe re-rating than the -7.81% intraday move seen after Q1.
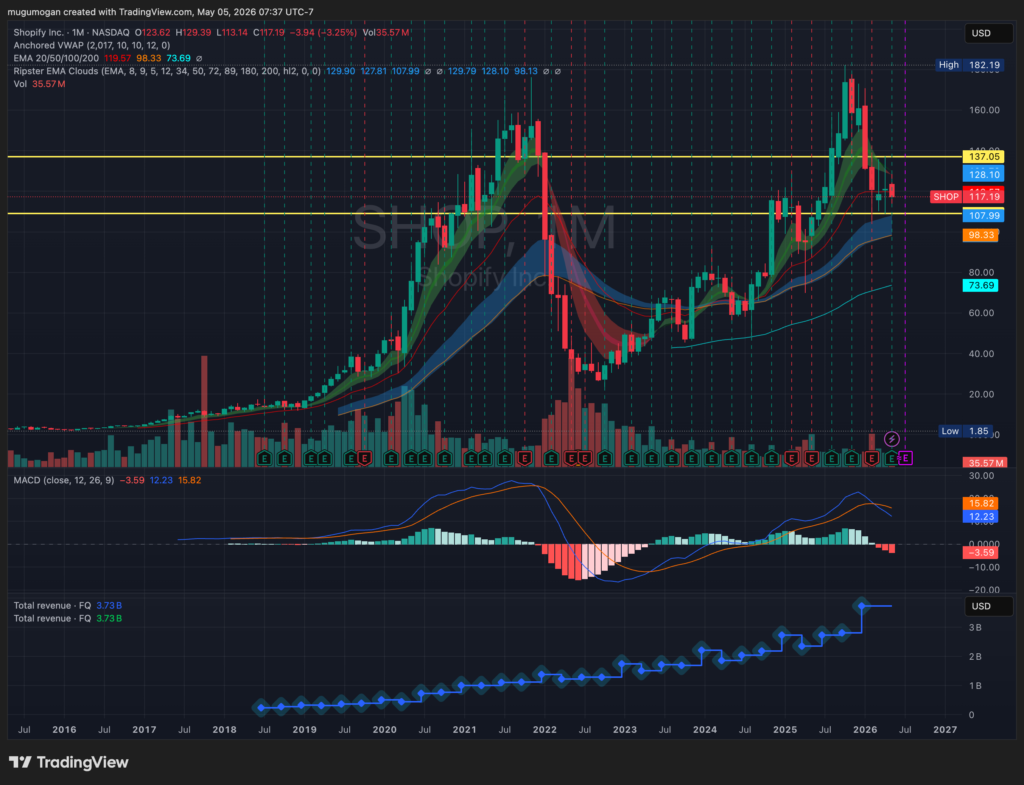
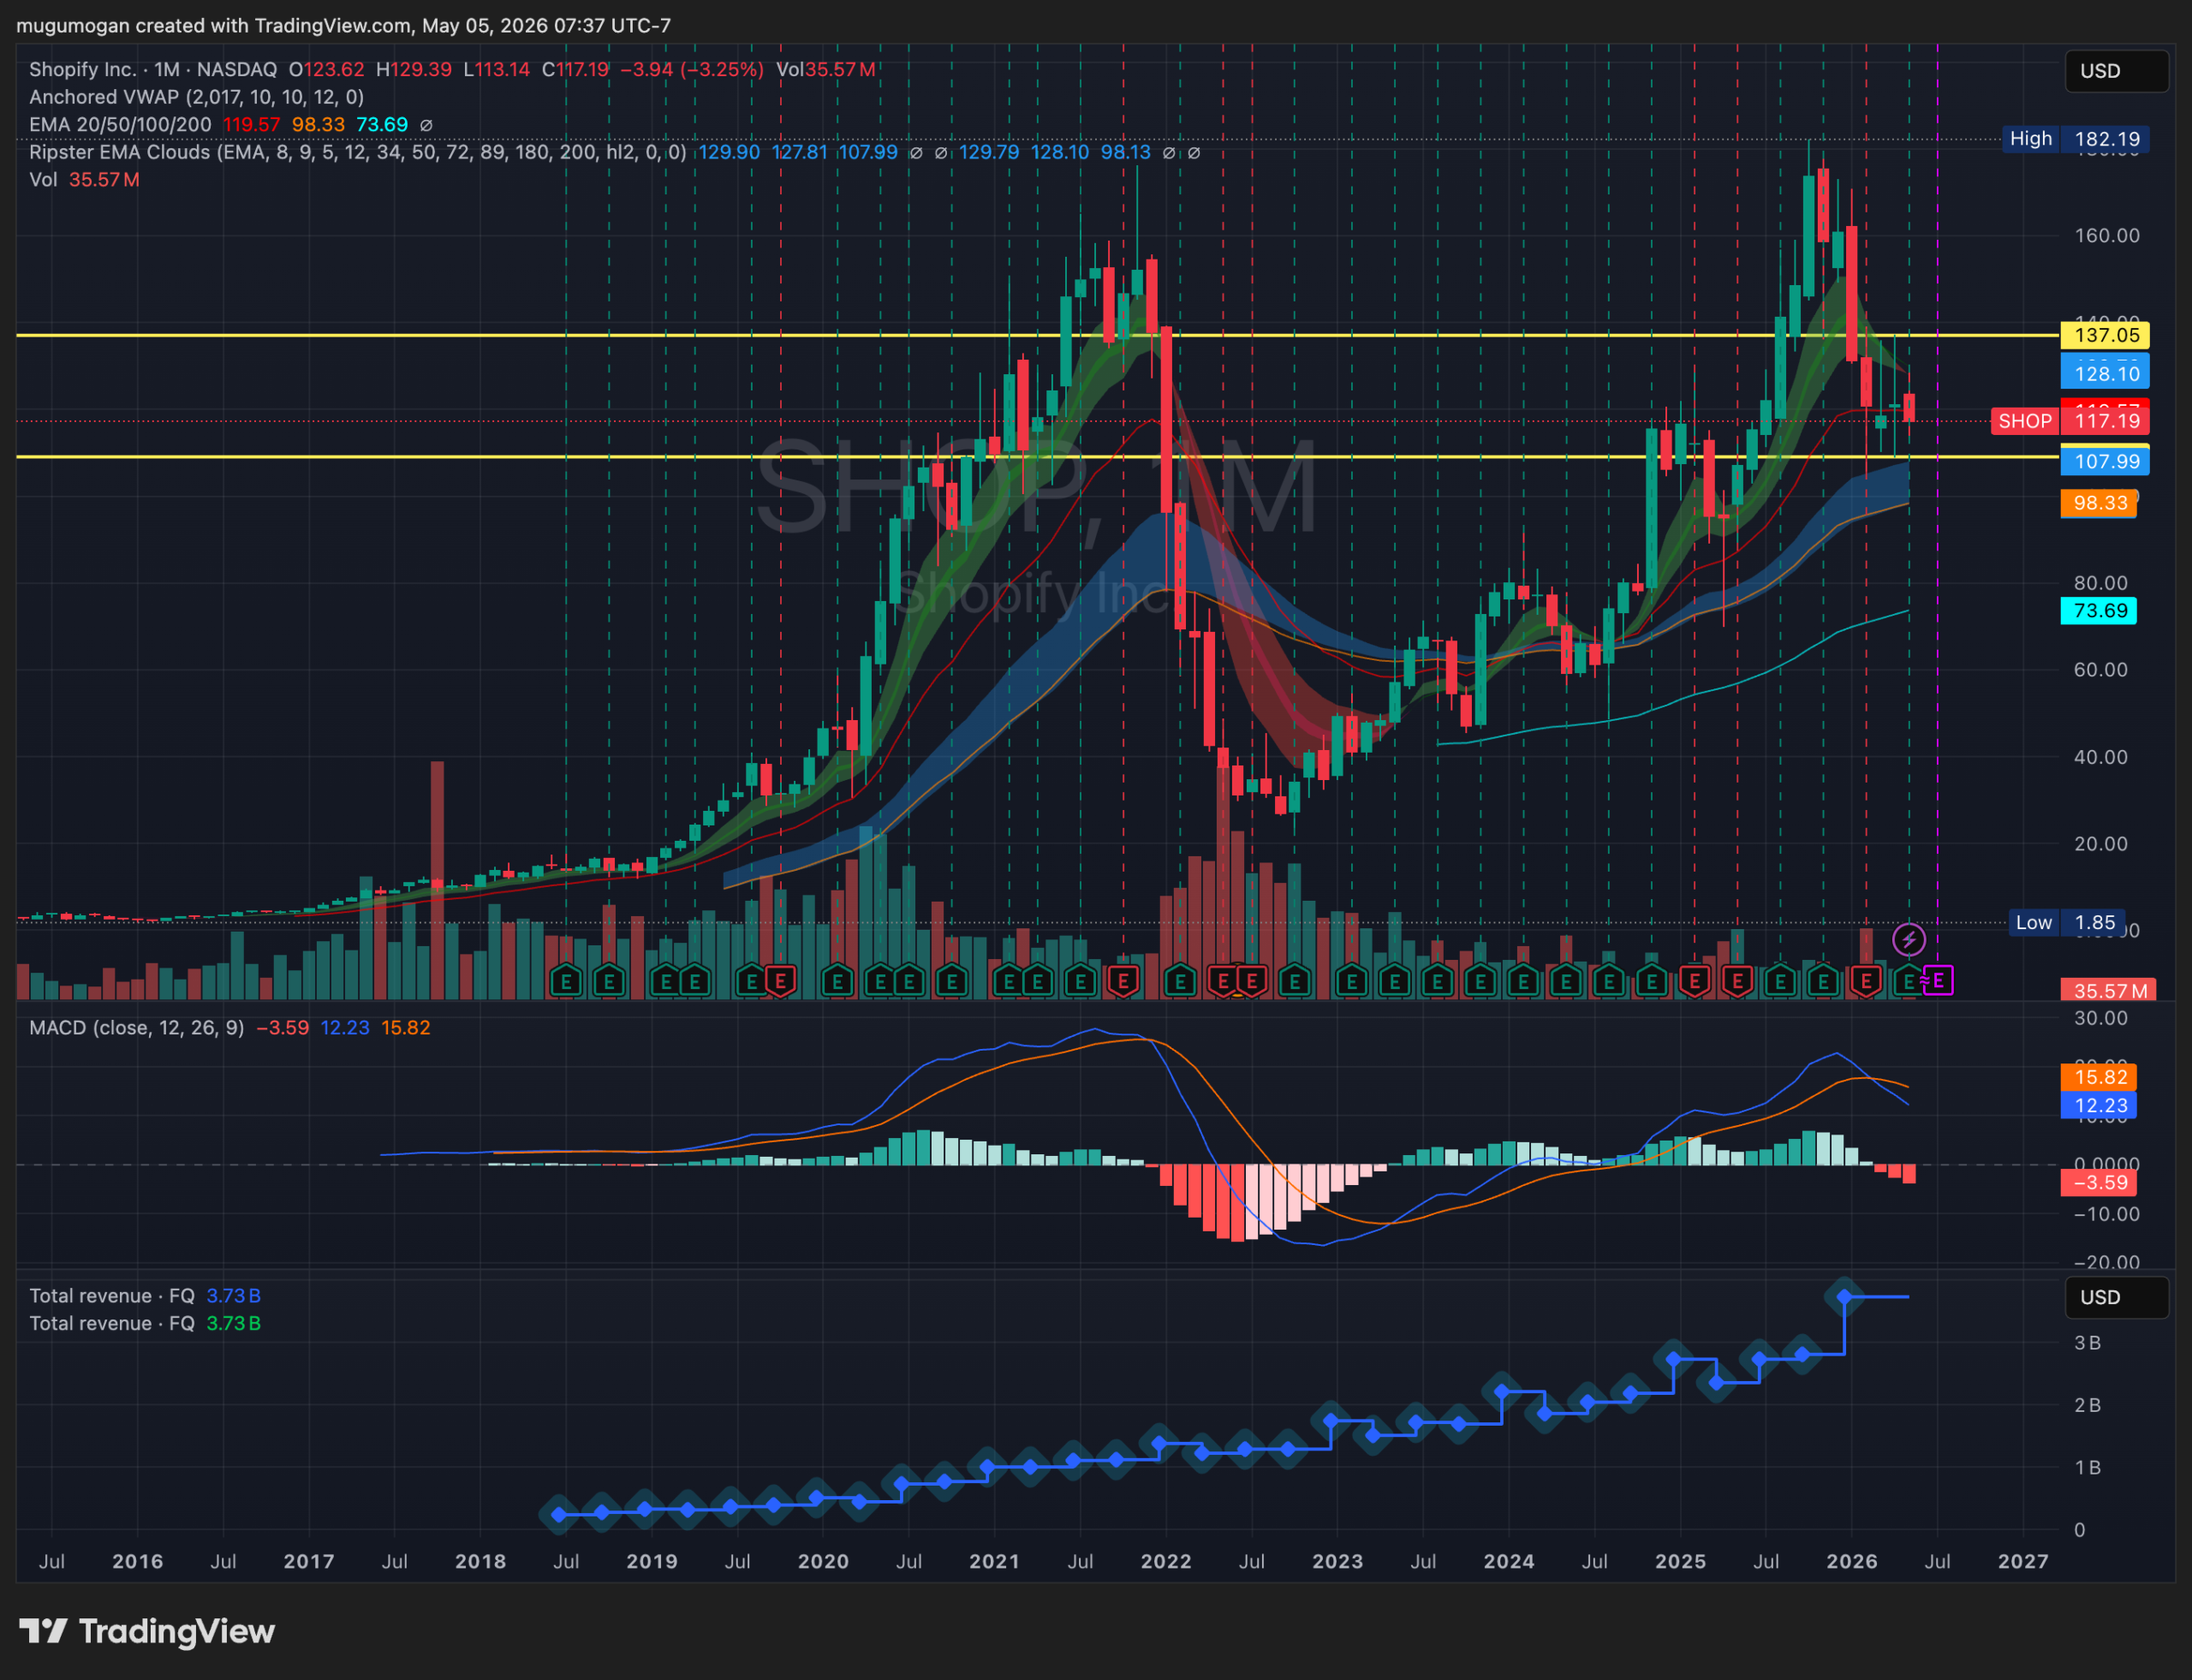
SHOP is in a corrective phase after a strong uptrend, but unlike PYPL, the higher timeframe structure is still intact with higher highs and higher lows. Price is currently testing a key support zone around ~$105–110; losing this level would likely trigger a deeper retracement toward the ~$95–100 range. Momentum (MACD) has rolled over and is crossing bearish, indicating short-term weakness rather than a trend reversal—for now. If it reclaims ~$128–135, the uptrend resumes; failure to hold current levels shifts this into a medium-term breakdown setup.
—
Disclaimer: This analysis is for informational purposes only and does not constitute investment advice. All data referenced is sourced from Bloomberg Terminal, FactSet, and publicly available earnings disclosures. Past performance is not indicative of future results.