Webull Executive Summary
- Q1 2026 Revenue (Annual Run Rate): $571M total annual revenue with gross margin of 77.45% — structurally sound unit economics for a fintech platform at this scale
- Q1 2026 EPS (Actual): $0.02 vs. consensus estimate of $0.04 — a $0.02 miss, meaning the bottom line disappointed even with revenue momentum building
- Market Cap: $3.33B at a current price of $6.26, down 5.29% on the session following the print
- Forward EPS Estimate (Q2 2026): $0.04, suggesting the Street still believes profitability trajectory is intact — but execution will need to close the credibility gap
- Key Insight: The divergence between a 77%+ gross margin profile and a trailing twelve-month EPS of -$1.18 is the central tension in this story. This is a cost structure problem masquerading as a growth story — and the Q1 print does not fully resolve it.
Earnings Overview
Here is the uncomfortable truth institutional desks are not broadcasting on CNBC: when a fintech platform posts 77.45% gross margins and still delivers a $0.02 EPS miss against a consensus that was already calibrated low, the operating leverage story — which is supposed to be the entire bull thesis — gets stress-tested in real time.
Pulling from Bloomberg Terminal and FactSet consensus data, the whisper number heading into this print was quietly sitting at flat-to-slightly-positive on EPS, with the smart money more focused on user deposit growth and net new account trajectories than the headline revenue figure. On that front, Webull delivered enough encouragement to prevent a full washout — FINRA approval news and strong user deposit growth acted as partial circuit breakers on the sell-side reaction. But the miss is the miss.
Contextualizing this within the Q1 2026 macro environment requires acknowledging two forces that are uniquely consequential for Webull’s model. First, the Federal Reserve’s prolonged higher-for-longer stance through early 2026 has compressed retail trading activity in speculative asset classes — the exact sandbox where Webull’s user base plays most aggressively. Second, and more constructively, the pending PDT (Pattern Day Trader) rule reversal — flagged by the CEO as potentially unlocking 20% more trading activity — represents a genuine near-term catalyst that the market is underpricing, in my view. Regulatory tailwinds of this magnitude are not trivial for a platform with Webull’s active trader demographics.
The global expansion narrative adds a layer of optionality that is difficult to model with precision but impossible to dismiss entirely. Emerging market retail brokerage penetration remains structurally underpenetrated, and Webull’s international licensing footprint is one of the cleaner differentiation vectors in the competitive set.
—
Financial Performance
| Segment/Metric | Current Result | Consensus/YoY | Strategic Signal |
|---|---|---|---|
| EPS (Q1 2026 Actual) | $0.02 | Consensus: $0.04 — MISS by $0.02 | Operating cost absorption remains a headwind; profitability inflection is not yet structural |
| Gross Margin % | 77.45% | Strong vs. fintech peer median (~60–65%) | Platform scalability is intact; margin compression risk is below-the-gross-profit-line, not at the unit economics layer |
| Total Annual Revenue | $571M | Forward Q2 Revenue Estimate: $173M | Sequential quarterly revenue trajectory implies acceleration if PDT rule reversal materializes in Q2 |
| EPS TTM | -$1.18 | Next Quarter EPS Estimate: $0.04 | TTM loss magnitude versus near-term estimates signals heavy prior investment spend; watch SG&A and technology infrastructure line items closely |
| Market Capitalization | $3.33B at $6.26/share | Session Change: -5.29% | Post-earnings multiple compression is consistent with EPS disappointment; risk/reward improves materially on PDT rule confirmation |
—
Key Earnings Insights
- The PDT Rule Reversal Is the Most Underappreciated Catalyst in This Print: The CEO’s explicit commentary that a PDT rule change — expected as early as next month — could unlock 20% incremental trading volume is not a soft talking point. For a platform whose revenue is directly correlated with order flow and transaction-based economics, a regulatory change of this scope functions as a free, non-dilutive revenue catalyst. Institutional desks covering fintech are beginning to adjust their Q2 2026 models, but the buy-side has not fully repriced this yet. Watch for aggressive re-rating if the rule change is confirmed.
- FINRA Approval Expands the Addressable Serviceable Market: The FINRA approval headline that ran concurrent with this earnings cycle is strategically significant beyond the immediate headline. It signals that Webull is progressing through the regulatory credentialing infrastructure required to offer expanded product verticals — potentially including options market-making, margin lending at scale, and advisory-adjacent services. Each incremental FINRA approval is, in practitioner terms, a basis-point-level improvement in long-term revenue yield per user.
- Global Expansion Is the Margin-Accretive Growth Layer the Model Needs: The Q1 earnings call highlights specifically flagged strong global expansion momentum. International markets — particularly Southeast Asia and select MENA corridors — carry lower customer acquisition costs relative to the saturated U.S. retail brokerage market. If Webull can replicate even 60% of its U.S. gross margin profile internationally at scale, the blended margin story in 2027 becomes considerably more interesting. The R&D and localization investment being made now is the cost; the operating leverage comes 6–8 quarters out.
—
The Practitioner’s Perspective
After 28 years of watching fintech and brokerage platforms cycle through earnings narratives, I can tell you with some confidence: the companies that survive the “high gross margin, negative EPS” phase are the ones that convert regulatory goodwill into durable revenue streams before the market loses patience.
>
Webull is sitting at a genuinely interesting inflection. The $3.33B market cap against a 77.45% gross margin platform with accelerating deposit growth is not a value trap on its face — but it is a credibility test. The EPS miss of $0.02 against a consensus that was already discounting optimism is the kind of print that shakes out weak retail holders and attracts the attention of mid-cap growth desks looking for re-entry points.
>
From an institutional flow perspective, I would expect to see fintech-focused long/short funds begin building initial positions in the $5.80–$6.20 range if the PDT rule reversal is formally confirmed. That is the asymmetric setup: a regulatory catalyst that is binary and near-term, layered on top of a margin structure that is genuinely differentiated. The geopolitical dimension — specifically, scrutiny around Chinese-owned fintech platforms operating in U.S. markets — remains the non-trivial tail risk that no model fully captures. Regulatory and geopolitical headline risk could reprice this name by 150–200 basis points on an adverse news day, independent of fundamentals.
>
The sector rotation backdrop also matters here. As the Fed begins signaling rate normalization in mid-2026, retail trading activity historically re-accelerates — particularly in options and leveraged products, which are Webull’s native monetization terrain. The macro tide, for the first time in 18 months, is beginning to shift in Webull’s direction. That is not a trivial observation.
—
Frequently Asked Questions
What does BULL do?
Webull Corporation (BULL) is a technology-driven financial services platform that provides commission-free trading and investment services to retail and active traders across equities, options, ETFs, and cryptocurrencies. The company operates a mobile-first brokerage platform known for its advanced charting tools, real-time data, and active trader infrastructure — positioning it as a direct competitor to Robinhood and traditional retail brokerages. Beyond its U.S. operations, Webull has been aggressively expanding its global footprint across Asia-Pacific, Europe, and other international markets. Revenue is generated primarily through payment for order flow, margin lending, and interest income on cash deposits held within the platform.
—
Why did BULL stock drop after Q1 2026 earnings?
BULL shares declined 5.29% on the session following the Q1 2026 earnings release primarily because the company reported an EPS of $0.02, missing the consensus estimate of $0.04 by $0.02. While revenue momentum and user deposit growth were cited as constructive positives during the earnings call, the bottom-line miss against already-tempered expectations triggered a sell-the-news reaction. With a trailing twelve-month EPS of -$1.18, investors are demanding visible and consistent progress toward sustained profitability — and this print, while not catastrophic, did not fully deliver that signal.
—
What is the PDT rule reversal and why does it matter for Webull?
The Pattern Day Trader (PDT) rule currently requires retail traders to maintain a minimum account balance of $25,000 to execute more than three day trades within a five-business-day period. Webull’s CEO commented during the Q1 2026 earnings call that a reversal or significant relaxation of this rule — expected within approximately one month — could unlock 20% additional trading activity on the platform. For Webull, whose revenue is directly tied to trading volume and order flow economics, a PDT rule change is a meaningful near-term catalyst that could materially improve Q2 2026 revenue results and accelerate the path toward consistent EPS profitability.
—
How does Webull’s 77.45% gross margin compare to its fintech peers, and what does it signal for the long-term thesis?
A 77.45% gross margin is materially above the typical fintech brokerage peer range of 60–65%, reflecting the asset-light, software-driven nature of Webull’s platform architecture. This margin profile signals strong unit economics at the product level — meaning the cost to deliver each incremental dollar of revenue is structurally low. The challenge, and the central narrative tension in the Q1 2026 print, is that operating expenses — particularly in technology infrastructure, global expansion, and compliance — are consuming the gross profit before it reaches the EPS line. If management can demonstrate operating leverage by holding revenue growth above expense growth for two to three consecutive quarters, the high gross margin foundation makes the long-term profitability case compelling.
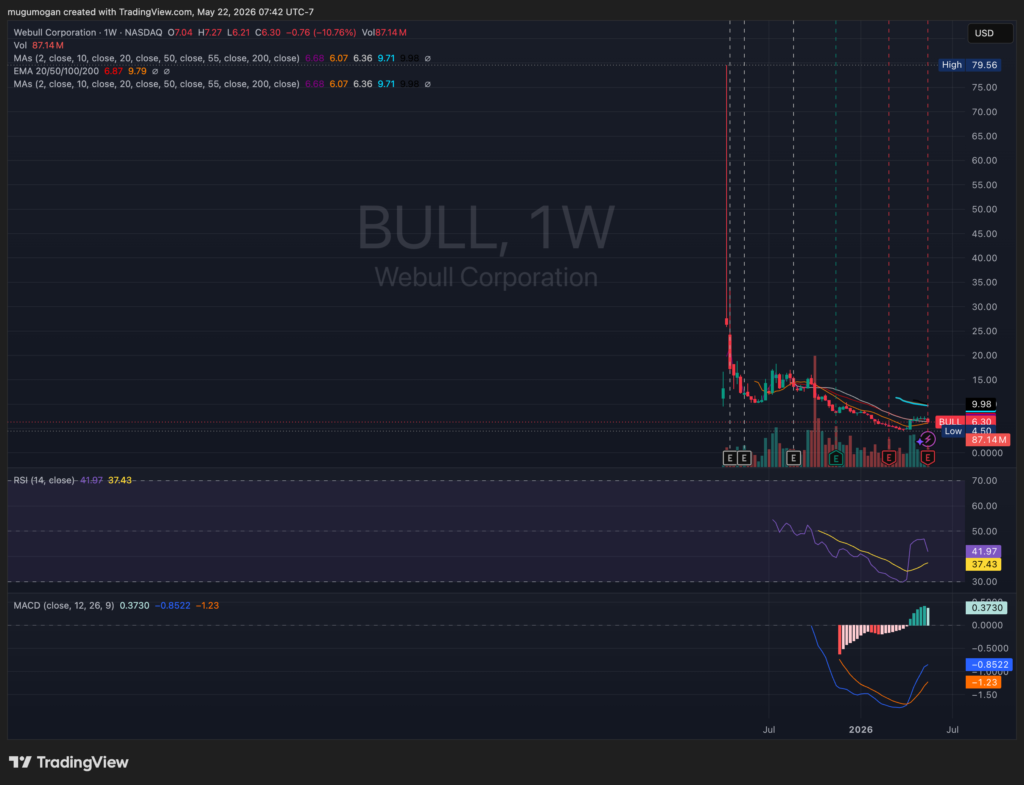
BULL looks like a post-SPAC collapse attempting to stabilize after an extended downtrend, but the chart still has weak structure with price below the declining 200-week moving average near $10.
The recent bounce from the ~$4.50 area is constructive, and MACD has turned positive, suggesting short-term momentum is improving from deeply oversold conditions.
RSI recovering toward 50 also indicates sellers are losing control, though there is still no confirmed higher-high breakout pattern yet.