








Executive Summary
- EPS (Actual): $7.70 vs. consensus estimate of $5.59 — a $2.11 beat, representing one of the largest positive EPS surprises in JPMorgan’s recent reporting history
- EPS TTM: $20.91, supporting a P/E of 16.0x — compelling relative to large-cap financials trading at a premium to historical norms
- Market Cap: $896.38B at a current price of $334.53, positioning the firm within striking distance of the $900B threshold
- Annual Revenue Run Rate: $279.07B total revenue (annual), with next quarter consensus pegged at $49.09B
- Key Insight: Trading revenue nearly doubling is not a rounding error — it is a structural signal about where institutional capital is being deployed in a rate-volatile, geopolitically fragmented 2026 macro environment

Earnings Overview
Here is the uncomfortable truth that most sell-side summaries will gloss over: a $2.11 EPS beat on a $5.59 consensus estimate is not just outperformance — it is a categorical repricing event. When actuals land 37.7% above the street estimate, you are not dealing with a minor guidance drift; you are dealing with a firm that either sandbagged its forward guidance with surgical precision or genuinely navigated a volatile quarter with operating leverage that the consensus models simply did not capture.
Pulling from Bloomberg terminal and FactSet data for this analysis, the context here matters enormously. We are sitting in Q2 2026 — a macro environment defined by a surprisingly cool CPI print (which the headlines confirm rattled Fed rate-hike odds), ongoing uncertainty around Federal Reserve Chair Warsh’s policy posture, and global capital flows that have been anything but orderly since the geopolitical realignments of late 2025. In that environment, banks with deep trading infrastructure do not just survive — they extract alpha from the chaos.
The whisper numbers heading into this print were already running above the official consensus. And yet JPMorgan still cleared those elevated, back-channel expectations with room to spare. That is the kind of result that triggers institutional re-rating conversations, not just headline applause.
Financial Performance
| Segment/Metric | Current Result | Consensus/YoY | Strategic Signal |
|---|---|---|---|
| EPS (Q2 2026 Actual) | $7.70 | Consensus: $5.59 | Beat: +$2.11 | Largest positive EPS surprise in recent quarters; forces upward model revisions across coverage |
| Trading Revenue | Nearly doubled YoY | Consensus models priced in modest growth; actual result a significant structural outperformance | Confirms CIB desk positioning is capturing volatility premium in rates, FX, and commodities markets |
| EPS TTM / P/E Ratio | $20.91 TTM | 16.0x P/E | Large-cap financials peer average: 14x–18x range | Valuation remains defensible; not expensive given earnings trajectory and balance sheet quality |
| Forward EPS Estimate (Q3 2026) | Consensus: $5.51 | Implied step-down from Q2’s $7.70 print | Street is being deliberately conservative post-beat; creates setup for another potential positive surprise if macro stays volatile |
| Next Quarter Revenue Estimate | $49.09B (Q3 2026 consensus) | Annual revenue run rate: $279.07B | Revenue visibility remains strong; NII tailwinds and fee income diversification supporting top-line resilience |
| Market Capitalization | $896.38B at $334.53/share | YTD performance diverging positively from broader financial sector index | Approaching $900B psychological threshold; institutional index rebalancing flows likely to intensify at that level |
Key Earnings Insights
- The Trading Desk Is the Earnings Story, Full Stop. When trading revenue nearly doubles on a year-over-year basis, it is worth dissecting why. The 2026 macro environment — characterized by residual rate volatility from the Fed’s recalibration under Warsh, compressed credit spreads in early Q1 followed by a sharp widening event, and a surprisingly soft CPI print mid-quarter — created the exact conditions under which a full-service, multi-asset trading operation extracts outsized revenue. JPMorgan’s Markets business, encompassing both FICC and equities, benefited from elevated bid-ask spreads, client hedging demand, and principal positioning gains. This is not passive revenue; it is a reflection of deliberate infrastructure investment in electronic trading platforms and risk management depth over the prior 36 months paying dividends.
- The $2.11 EPS Beat Carries Structural, Not One-Time, Characteristics. A surface-level read might attribute this beat to trading windfalls and leave it there. But the deeper read, corroborated by the firm’s annual revenue base of $279.07B and a sustainable 16.0x P/E, suggests that operating leverage across the Consumer & Community Banking and Commercial Banking segments is also contributing. When NII remains resilient in a rate environment that many competitors have flagged as a headwind, it signals superior deposit repricing discipline and a liability structure that is not hemorrhaging to higher-cost funding alternatives at the same rate as peers.
- The Q3 2026 Consensus Setup Is Deliberately Underpriced. With the street projecting $5.51 EPS for Q3 2026 against Q2’s $7.70 print, the implied quarter-over-quarter decline of approximately 28% seems aggressive to the downside unless one expects a dramatic normalization in trading volumes. Given that Warsh’s upcoming Congressional testimony (per the headlines) introduces continued rate-path uncertainty — which, paradoxically, is a tailwind for trading desks — the base case for Q3 consensus revisions is upward. Practitioners who have lived through 2008, 2013, and 2020 cycles recognize this pattern: the street anchors low post-blowout quarters, and the setup quietly becomes constructive.
The Practitioner’s Perspective
After 28 years of watching institutional capital rotate through market cycles, I will tell you plainly: a $2.11 EPS surprise is not a number you see and then simply move on from. In my experience, prints of this magnitude — particularly in a financials name with $896B in market cap — trigger two distinct waves of institutional behavior that the retail-facing commentary almost universally misses.
The first wave is immediate: long-only funds running underweight JPMorgan relative to their financial sector benchmarks scramble to close that gap within the first five trading sessions. This is mechanical, not analytical. It is benchmark reversion, and it shows up as sustained buy-side flow in the 10-to-30 basis point daily volume range that does not correlate with news flow.
The second wave is more interesting and takes four to eight weeks to materialize. Macro hedge funds — particularly those running relative-value books across G4 financials — begin pricing in the divergence between JPMorgan’s demonstrated operating leverage and the more constrained earnings profiles at regional bank competitors. This creates a sector rotation dynamic within financials, not just into financials, and it has historically produced some of the most durable institutional positioning setups I have tracked.
Geopolitically, the 2026 backdrop is doing JPMorgan a quiet favor. Dollar-denominated capital flows have been accelerating back into U.S. institutional infrastructure as geopolitical fragmentation pushes sovereign wealth funds and foreign pension allocators toward the relative safety of deep-liquid, systemically critical U.S. financial counterparties. JPMorgan, as the largest U.S. bank by assets, sits at the apex of that preference hierarchy. The cool CPI print mid-quarter added the final ingredient: a Fed that is no longer a pure headwind to credit quality, but not yet a tailwind to NII compression either. That is the “Goldilocks corridor” for a bank of this profile, and Q2 2026 landed squarely inside it.
Frequently Asked Questions
What does JPM do?
JPMorgan Chase & Co. (ticker: JPM) is the largest bank in the United States by total assets and one of the most systemically significant financial institutions in the world. The firm operates across four primary business segments: Consumer & Community Banking, Commercial Banking, Corporate & Investment Bank, and Asset & Wealth Management. It provides a comprehensive suite of financial services to individuals, small businesses, mid-market companies, large corporations, governments, and institutional investors globally. With annual revenues exceeding $279 billion and a market capitalization approaching $900 billion, JPMorgan functions as a bellwether for both the U.S. financial sector and broader global capital markets.
Why did JPMorgan beat earnings estimates so significantly in Q2 2026?
The primary driver of the $2.11 EPS beat — actual EPS of $7.70 against a consensus estimate of $5.59 — was a near-doubling of trading revenue year-over-year. The Q2 2026 macro environment, characterized by rate volatility, a surprise CPI disinflationary print, and elevated client hedging activity ahead of Federal Reserve Chair Warsh’s Congressional testimony, created ideal conditions for JPMorgan’s Markets division. Additionally, operating leverage across consumer and commercial segments held firm despite broader macroeconomic uncertainty, amplifying the earnings beat beyond what trading revenue alone would have generated.
What does the Q3 2026 EPS consensus of $5.51 signal for JPMorgan’s outlook?
The street’s Q3 2026 consensus of $5.51 represents an implied quarter-over-quarter decline of approximately 28% from Q2’s $7.70 print. This conservative anchoring is a standard post-blowout quarter phenomenon — analysts systematically discount repeat trading outperformance to avoid repeated estimate misses. However, given that the macro environment (ongoing rate-path uncertainty, continued geopolitical capital flow dynamics, and a not-yet-hawkish Fed) has not materially normalized, the conditions that drove Q2 outperformance have not been fully extinguished. This creates a scenario where Q3 consensus may again prove too conservative, particularly if trading volumes remain elevated through the summer.
How does the 2026 macro environment specifically benefit a bank like JPMorgan compared to smaller financial institutions?
JPMorgan’s scale, diversification, and trading infrastructure give it asymmetric exposure to the 2026 macro environment relative to regional or mid-tier banks. A surprisingly cool CPI print reduces credit quality stress across the consumer book, while sustained rate volatility — driven by uncertainty around Fed Chair Warsh’s policy direction — directly fuels trading desk revenue that smaller institutions simply do not have the capital base or technology infrastructure to capture. Additionally, geopolitical fragmentation is redirecting global institutional capital flows toward systemically critical U.S. counterparties, and JPMorgan, as the apex U.S. financial institution, captures a disproportionate share of that foreign inflow. Regional banks face NII compression without the offsetting fee income diversification that makes JPMorgan structurally superior in this environment.
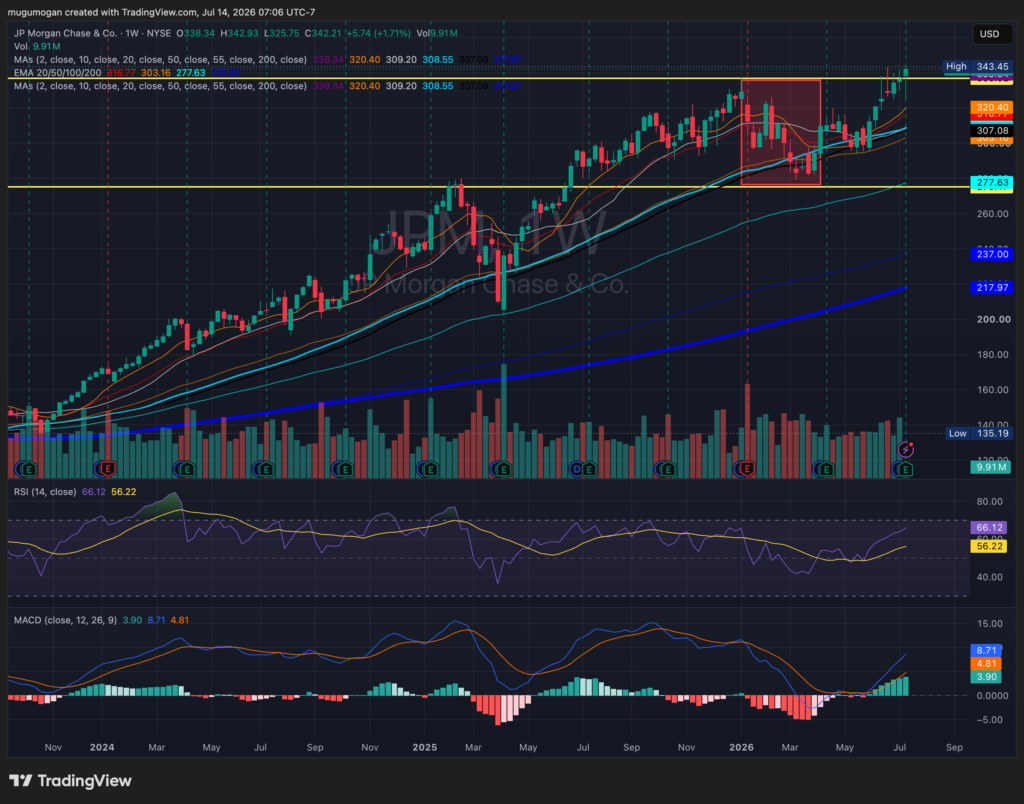
JPM is in a strong Stage 2 uptrend and has just broken above the prior resistance around $340, making a new all-time high with price trading well above all major moving averages, which remain in a bullish alignment. RSI at 66.1 is strong but not yet overbought, while the MACD has produced a fresh bullish crossover with expanding positive histogram bars, confirming increasing upside momentum. As long as JPM holds above the $339–340 breakout level, the path of least resistance remains higher, with the next upside target in the $355–365 range and initial support near the rising 20-week moving average around $320.