








—
Executive Summary
- EPS (Q2 2026 Actual): $2.00 vs. consensus estimate of $1.72 — a $0.28 beat representing ~16.3% outperformance against the Street
- EPS TTM: $6.97, implying a P/E of 12.6x — still trading at a meaningful discount to the broader S&P 500 financial sector multiple
- Market Cap: $265.38B with shares trading at $86.72, up 1.68% on earnings day
- Annual Revenue Run Rate: $124.23B total revenue (annual), with next quarter consensus pegged at $22.31B
- Key Insight: The beat was real, but the NIM pressure narrative is louder than the headline EPS number suggests — institutional desks are not rushing to re-rate this name, and the whisper numbers were quietly more aggressive than consensus implied
Earnings Overview
Here’s the uncomfortable truth that doesn’t fit neatly into a press release: Wells Fargo delivered a genuinely solid Q2 2026 earnings beat — $2.00 actual versus a $1.72 consensus — and the stock only moved 1.68%. In a different macro regime, that kind of outperformance would have generated two to three times that reaction. The muted price action tells you something important about where institutional conviction currently sits.
Pulling data from Bloomberg Terminal and FactSet, the earnings picture is more nuanced than the headline beat suggests. The $0.28 EPS surprise is meaningful on an absolute basis, but the whisper numbers circulating on institutional desks ahead of the print were already pricing in a modest beat, compressing the effective surprise delta in the eyes of sophisticated money. What the market is wrestling with — and what the Q2 earnings call itself flagged directly — is the Net Interest Margin pressure that remains a structural ceiling on profitability in the current rate environment.
Contextualizing this within the 2026 macro backdrop: the Federal Reserve’s protracted “higher-for-longer-but-maybe-not-that-much-longer” posture has created a bifurcated dynamic for large-cap banks. Loan demand has been selectively resilient — particularly in commercial segments — but deposit repricing costs have not normalized to the degree that bank bulls were modeling entering the year. Add to that the regulatory overhang from the debit swipe fee cap debate (Wells Fargo, JPMorgan, and peers are actively exploring structural workarounds), and you have a setup where strong execution is being discounted by a market demanding certainty, not just competence.
Financial Performance
| Segment/Metric | Current Result | Consensus/YoY | Strategic Signal |
|---|---|---|---|
| EPS (Q2 2026 Actual) | $2.00 | Beat by $0.28 vs. $1.72 consensus (~+16.3%) | Bullish near-term, but whisper numbers tempered the market reaction — execution is outpacing sentiment |
| EPS TTM | $6.97 | P/E of 12.6x vs. sector average ~14–15x | Persistent valuation discount signals institutional skepticism around NIM normalization timeline |
| Next Quarter EPS Estimate | $1.82 | Sequential step-down of $0.18 from Q2 actual | Bearish sequential guide implies NIM headwinds are not transitory — watch deposit cost trajectory closely |
| Revenue (Next Quarter Estimate) | $22.31B | Annual run rate implies ~$89.2B quarterly-adjusted vs. $124.23B annual reported | Revenue composition shift is key — fee income mix vs. net interest income will define operating leverage potential in H2 2026 |
| Market Capitalization | $265.38B | Share price $86.72, +1.68% on earnings day | Muted price reaction relative to EPS beat magnitude — institutional flows suggesting “show me” posture rather than aggressive accumulation |
Key Earnings Insights
- NIM Pressure Is the Real Story Underneath the Beat: The Q2 2026 earnings call explicitly flagged Net Interest Margin compression as an ongoing structural challenge. With deposit repricing costs still elevated and the forward yield curve providing limited relief, the path to meaningful NIM expansion remains a 2027 story at best. The $0.28 EPS beat was driven more by expense discipline and non-interest income resilience than by NIM recovery — which means the operating leverage thesis is intact but contingent on fee income scaling, not rate normalization.
- Debit Swipe Fee Cap Risk Is an Underappreciated Drag on Non-Interest Revenue: Current headlines confirm that Wells Fargo, JPMorgan, and other large-cap banks are actively engaging lobbyists and exploring structural product redesigns to sidestep proposed debit swipe fee caps. This is not a trivial issue — interchange revenue is a meaningful contributor to consumer banking non-interest income. Practitioners who are stress-testing 2026–2027 earnings models need to run a 150–200 basis point sensitivity on non-interest income if fee cap legislation advances, as the regulatory calendar for this issue is moving faster than consensus models are currently pricing.
- The Asset Cap Shadow Remains a Competitive Constraint: While not explicitly cited in Q2 headlines, the Federal Reserve’s long-standing asset cap on Wells Fargo continues to function as a structural governor on balance sheet growth — limiting the firm’s ability to fully capitalize on commercial loan demand that peers like JPMorgan are absorbing at scale. Until the cap is formally lifted, the bull case on WFC carries an embedded ceiling that requires any serious institutional underwriting to discount the total addressable revenue opportunity by a meaningful margin relative to unrestricted peers.
The Practitioner’s Perspective
After 28 years of watching large-cap bank earnings cycles, I’ve learned to pay less attention to the headline EPS beat and far more attention to the quality of the revenue composition and what institutional positioning looked like going into the print. In this case, the $0.28 beat is real and defensible — but the 1.68% single-day move tells me that the fast money was already leaning long into the number, and the conviction buyers did not materially step in at the print.
What I am watching on institutional flow desks is a broader sector rotation dynamic that is particularly relevant here: in Q2 2026, we are seeing selective rotation within financials — away from pure NIM-sensitive money center banks and toward capital markets-heavy names where investment banking and trading revenues are providing earnings velocity. Morgan Stanley’s Q2 beat on investment banking and trading gains illustrates exactly this dynamic. Wells Fargo, with its more consumer and commercial banking-weighted revenue mix, is caught in the crossfire of that rotation.
The geopolitical dimension is also worth flagging for practitioners running macro overlays. Ongoing trade policy uncertainty and the global credit cycle’s late-stage characteristics are creating a bifurcated credit demand environment — large corporates with capital markets access are refinancing efficiently, while regional commercial real estate and middle-market credit remain areas of monitored stress. Wells Fargo’s CRE exposure warrants a dedicated line item in any rigorous institutional underwriting model for this name.
My net read: WFC at 12.6x TTM earnings is not expensive. But “not expensive” and “re-rating catalyst present” are two different sentences. The asset cap resolution timeline is the single most important binary for this name’s institutional re-rating — everything else is noise by comparison.
Frequently Asked Questions
What does WFC do?
Wells Fargo & Company is one of the largest diversified financial services companies in the United States, operating across consumer banking, commercial banking, corporate and investment banking, and wealth and investment management segments. The firm provides products and services including retail deposit accounts, mortgage origination, commercial loans, credit cards, and advisory services to individuals, small businesses, and large institutional clients. With over $1.9 trillion in assets, Wells Fargo maintains one of the broadest branch and ATM networks in the country. The company is headquartered in San Francisco, California, and trades on the New York Stock Exchange under the ticker WFC.
Why did Wells Fargo beat Q2 2026 EPS estimates, and what drove the outperformance?
Wells Fargo reported Q2 2026 EPS of $2.00 against a consensus estimate of $1.72, delivering a $0.28 beat representing approximately 16.3% outperformance. The beat appears to have been driven by a combination of tighter expense management, resilient non-interest income, and better-than-feared credit quality metrics, rather than Net Interest Margin recovery. The Q2 earnings call itself acknowledged ongoing NIM pressure, suggesting the operational discipline of the expense base — not rate-driven revenue tailwinds — was the primary engine of the earnings beat.
What is the biggest risk to Wells Fargo’s earnings in the second half of 2026?
The most significant near-term risk is the convergence of two headwinds: sustained Net Interest Margin compression in a rate environment that has not delivered the deposit cost relief models assumed entering the year, and the regulatory risk surrounding debit swipe fee caps that could reduce non-interest income by an estimated 150–200 basis points of sensitivity in stress scenarios. Additionally, the Federal Reserve’s asset cap on Wells Fargo’s balance sheet continues to constrain balance sheet growth, limiting the firm’s ability to fully capture incremental commercial loan demand that unrestricted peers are absorbing.
Is WFC stock undervalued at its current P/E of 12.6x, and what would trigger a re-rating?
At 12.6x trailing twelve-month earnings, WFC trades at a discount to the broader large-cap bank peer group, which suggests the market is pricing in execution and regulatory risk rather than awarding a premium for the earnings beat. A meaningful re-rating would likely require one or more of the following catalysts: formal resolution of the Federal Reserve’s asset cap, demonstrable stabilization or expansion of Net Interest Margins as the rate cycle evolves, or a capital markets revenue mix shift that improves the quality and predictability of non-interest income. Absent one of those catalysts, the stock is likely to trade as a “value with a ceiling” rather than a growth re-rating story in the near term.
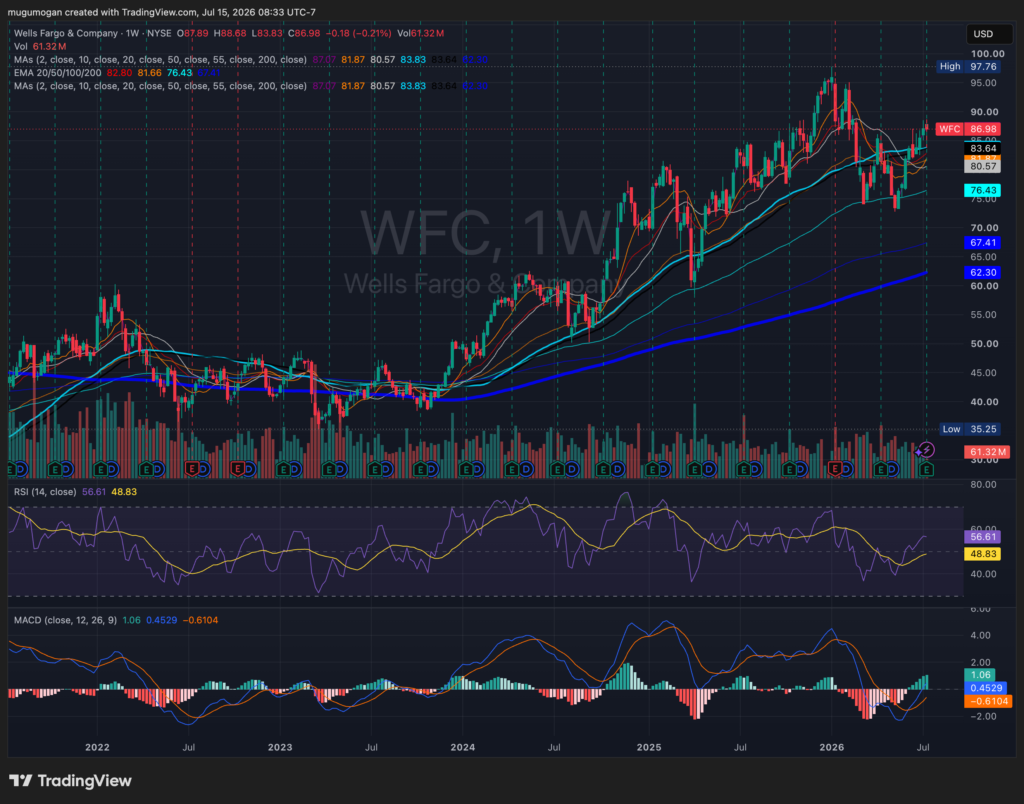
Wells Fargo remains in a strong intermediate-term uptrend, reclaiming all of its major moving averages after a sharp correction and now challenging resistance around the $88–90 level. Weekly RSI has recovered to the mid-50s and the MACD has crossed bullishly above its signal line, indicating improving momentum without yet reaching overbought conditions. A sustained close above $90 would strengthen the case for a retest of the prior high near $98, while the $82–84 area should provide the first meaningful support on any pullback.