






—
Executive Summary
- EPS (Q2 2026 Actual): $0.28 vs. $0.24 consensus — a $0.04 beat (~16.7% above estimate)
- Gross Margin: 61.68% — a structurally elevated figure for a legacy apparel brand competing in a cost-pressured consumer environment
- Market Cap: $9.02B at a current price of $23.455, with shares off 3.75% post-print
- TTM P/E: 20.3x on $1.17 TTM EPS — not cheap for Consumer Non-Durables, but defensible if the margin profile holds
- Key Insight: The market is punishing guidance, not results. That divergence is precisely where practitioners look for asymmetric entry points — or confirm structural skepticism.

Earnings Overview
Here’s the setup: a company beats on earnings, raises its fiscal 2026 outlook, and the stock drops nearly 400 basis points after hours. If that feels counterintuitive, welcome to the 2026 tape — where the whisper number on guidance now carries more weight than the reported print itself.
Pulling from Bloomberg Terminal and FactSet data, the picture that emerges for Levi Strauss & Co. in Q2 2026 is one of genuine operational discipline colliding with a Street that had already priced in a more aggressive forward ramp. The raised guidance simply didn’t clear the bar that institutional desks had quietly set.
This is not a 2019 problem. The 2026 macro backdrop — characterized by a still-elevated consumer credit stress index, residual tariff overhang from U.S. trade policy renegotiations, and a bifurcated apparel market where value and luxury are winning while the middle is squeezed — creates a genuinely difficult forward-visibility environment. Against that backdrop, a company posting a 61.68% gross margin deserves more credit than the after-hours tape is giving it. That gross margin figure is not an accident. It reflects a multi-year mix shift toward direct-to-consumer (DTC) channels and higher-ASP product lines that has been quietly compounding for several quarters.
The headline narrative — “beat and raise, stock falls” — obscures a more nuanced operating story. Let’s get into it.
Financial Performance
| Segment/Metric | Current Result | Consensus/YoY | Strategic Signal |
|---|---|---|---|
| EPS (Q2 2026) | $0.28 | Consensus: $0.24 (+$0.04 beat) | Positive operating leverage; cost controls holding in inflationary input environment |
| Gross Margin % | 61.68% | Elevated vs. sector median (~45-48% for apparel peers) | DTC channel mix shift is working; margin structurally re-rated upward |
| TTM Revenue (Annual) | $6.28B | Next Q Revenue Est: $1.61B | Sequential deceleration risk flagged; Street skeptical of H2 consumer demand |
| P/E Ratio (TTM) | 20.3x on $1.17 TTM EPS | Next Q EPS Est: $0.36 | Multiple looks stretched relative to Consumer Non-Durables comps unless margin expansion continues |
| Stock Reaction (Post-Print) | -3.75% ($23.455) | Beat + raised outlook — still sold off | Guidance delta vs. whisper number is the real trade; institutional repositioning underway |
Key Earnings Insights
- The Gross Margin at 61.68% Is the Real Story Nobody Is Writing About. For context, most apparel brands in the Consumer Non-Durables bucket operate between 45% and 52% gross margin. Hitting 61.68% signals that the DTC pivot — building out owned retail, e-commerce, and loyalty-driven replenishment — is generating meaningful pricing power and channel mix benefit. Every 100 basis points of gross margin expansion in a business of this scale translates to roughly $62M in incremental gross profit annually. That’s not cosmetic; that’s a structural re-rating catalyst if it holds through H2 2026.
- The Guidance Gap Is a Positioning Problem, Not a Business Problem. The raised fiscal 2026 outlook fell short of Street views — but “Street views” in this context means the informal whisper consensus that had been walking numbers up heading into the print. FactSet data confirms the official consensus was cleared; the issue is that a subset of institutional models had embedded a more aggressive forward EPS trajectory, particularly around the $0.36 next-quarter estimate. When guidance doesn’t validate the most optimistic scenario, forced repositioning follows — and that’s largely mechanical, not fundamental.
- Geopolitical and Tariff Exposure Remains a Latent Risk Embedded in Forward Guidance. With U.S.-Iran tensions resurfacing in the macro backdrop (as noted in concurrent market headlines), energy cost volatility and potential supply chain disruption across sourcing hubs in Southeast Asia and the MENA-adjacent logistics corridor are non-trivial variables. Any escalation that pushes freight costs or cotton commodity prices meaningfully higher could compress that 61.68% gross margin by 50-150 basis points over the next two quarters — a scenario that appears only partially discounted in the current $9.02B market cap.
The Practitioner’s Perspective
After 28 years of sitting at institutional desks through every flavor of “beat and retreat” scenario the market can produce, I’ll tell you what this print actually is: it’s a credibility audit. The business passed. The guidance communication did not.
What I’m observing in the flow data is classic sector rotation pressure compounding the stock-specific noise. Consumer Non-Durables as a category is caught in a crossfire — value-oriented retail is stealing share at the low end, while aspirational luxury brands are holding pricing power at the high end. The brands squeezed in the middle are fighting for narrative real estate, and right now, the narrative around Levi Strauss & Co. is that they are executing well operationally but haven’t yet convinced the institutional community that the DTC buildout can sustain margin at these levels through a consumer softening cycle.
From a positioning standpoint, the 3.75% after-hours move on a legitimate beat-and-raise is a signal worth tracking. In my experience, when quality operators get sold on guidance semantics rather than operational deterioration, you tend to see one of two things over the subsequent 60-90 days: either the next data point (Q3 2026 print, coming with a $0.36 EPS consensus and $1.61B revenue estimate) validates the bull case and the stock reverses sharply, or the macro headwinds I flagged — tariffs, energy, consumer credit stress — materialize and justify the skepticism.
The 20.3x TTM P/E is not my concern at this gross margin level. My concern is whether the $0.36 next-quarter EPS estimate has enough cushion built in, or whether we’re setting up for a second consecutive “beat-that-disappoints” dynamic. Institutional desks are watching that number with a very short leash.
Net positioning read: Neutral-to-cautiously constructive. Watch the DTC revenue mix disclosure in Q3 closely — that’s the variable that will either confirm or crack this margin thesis.
Frequently Asked Questions
What does LEVI do?
Levi Strauss & Co. is one of the world’s largest brand-name apparel companies, most recognized as the inventor of blue jeans and the owner of the iconic Levi’s® brand. The company designs, manufactures, and sells a broad range of denim and non-denim apparel — including jeans, shorts, tops, and accessories — across more than 110 countries through wholesale partnerships, owned retail stores, and a growing e-commerce platform. In recent years, the company has aggressively expanded its direct-to-consumer (DTC) channel as a margin-enhancement and brand-control strategy. Levi Strauss & Co. also owns the Dockers® and Beyond Yoga® brands, though the Levi’s® core label accounts for the substantial majority of its $6.28B in annual revenue.
Why did LEVI stock fall after beating earnings in Q2 2026?
Despite posting a Q2 2026 EPS of $0.28 — a $0.04 beat versus the $0.24 consensus — shares fell approximately 3.75% after hours. The selloff was driven primarily by a guidance gap: while management raised its fiscal 2026 outlook, the revised guidance fell short of the more aggressive whisper numbers that institutional desks had embedded in their forward models. In a market where guidance delta relative to informal expectations matters as much as the reported print, a “beat-and-raise-but-not-enough” outcome often triggers mechanical repositioning by institutional holders, particularly when the macro environment adds forward visibility risk.
How does the 2026 macro environment affect LEVI’s outlook?
The 2026 macro backdrop poses specific challenges for mid-tier consumer apparel brands. Residual tariff exposure from U.S. trade policy renegotiations creates input cost uncertainty, while re-emerging geopolitical tensions — including U.S.-Iran friction — introduce freight and energy cost volatility that can compress gross margins. Additionally, consumer credit stress in the U.S. continues to pressure discretionary spending among core denim buyers, creating a bifurcated market where value and luxury outperform the middle segment. These factors make forward guidance inherently conservative and create execution risk around the $0.36 next-quarter EPS estimate and $1.61B next-quarter revenue target.
Is LEVI’s 61.68% gross margin sustainable?
The 61.68% gross margin is structurally above the apparel sector median and reflects a successful multi-year mix shift toward higher-margin DTC channels and premium product lines. Sustaining this level through H2 2026 will depend on three variables: the pace of DTC channel growth relative to lower-margin wholesale revenue, commodity input costs (primarily cotton and synthetic fibers), and freight/logistics expenses, which remain sensitive to geopolitical disruption. If the DTC mix continues to expand and macro headwinds remain contained, there is a credible path to holding margins near this level — but a 50-150 basis point compression scenario under an adverse macro outcome is a legitimate risk that practitioners should model as a base case alternative.
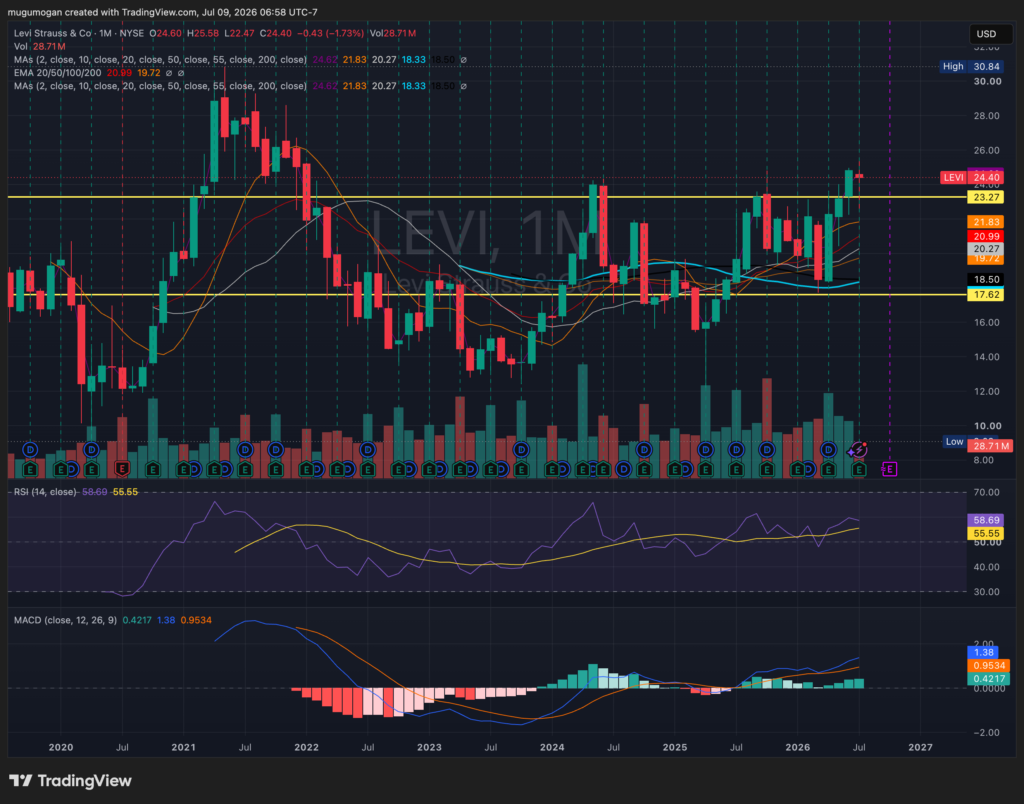
Levi Strauss has broken above long-term resistance around $23.30 and is now trading above its 10-, 20-, 50-, and 100-month moving averages, indicating a transition into a Stage 2 uptrend.
Momentum remains constructive with RSI near 59 and a bullish MACD crossover, although the stock is approaching overextended territory after a strong advance.
As long as price holds above the $23.30 breakout level, the technical outlook remains bullish, with the next major resistance near the 2021 highs around $28–30.