EPS (Actual): $5.11 vs. an implied estimate of ~$2.68 — a $2.43 beat, representing roughly a 91% upside surprise to consensus
Market Cap: $4.45 trillion, cementing Alphabet’s position among the most valuable enterprises in the history of public markets
Gross Margin: 59.68% — a level that signals structural efficiency gains, not cyclical tailwinds
P/E (TTM): 34.1x on $10.91 TTM EPS — still palatable for a business compounding at this velocity
Key Insight: The whisper numbers on the Street were already above published consensus, yet Alphabet blew past those too — this is not a sandbagging story; this is a monetization inflection in AI-augmented search and cloud infrastructure that the models simply weren’t pricing correctly
—
Earnings Overview
When a $4.45 trillion market cap company delivers a 91% EPS beat, the word “surprise” no longer covers it. This is a structural repricing event.
Pulling from Bloomberg Terminal and FactSet data, the picture that emerges for Q1 2026 is one of a company that has spent the better part of three years absorbing massive capital expenditure into its AI and cloud infrastructure stack — and is now exhaling that investment as margin expansion and earnings power. The operating leverage embedded in Alphabet’s cost structure is not theoretical anymore; it is showing up in the income statement with authority.
Contextualizing this within the 2026 macro environment is critical. We are operating in a landscape where the Fed’s preferred inflation gauge recently hit a two-year high, where AI-linked capital expenditure across the industry is racing toward $800 billion, and where the Nasdaq Composite — battered and recalibrated through 2025’s rate volatility — is now finding its footing on the back of exactly this kind of earnings quality. Alphabet did not merely beat the number. It beat it in a macro environment where investors are acutely distinguishing between companies that talk about AI monetization and those that are printing it on the P&L. Alphabet is firmly in the latter camp.
The 5.37% single-session price move to $368.74 is the market doing what it does when consensus was structurally wrong: it resets — fast.
Fixed-cost absorption from data center buildout now yielding incremental flow-through — classic late-cycle operating leverage
Total Annual Revenue Run Rate
$402.96B (TTM)
Next Q Revenue Est: $114.48B
Consensus expects continued sequential acceleration — forward guide likely conservative given Q1 trajectory
P/E Ratio (TTM)
34.1x on $10.91 TTM EPS
Market Cap: $4.45T
Multiple remains defensible — at this earnings growth rate, the PEG compresses meaningfully; re-rating risk is to the upside
Next Quarter EPS Estimate
$2.81 (Street Consensus)
vs. $5.11 printed in Q1
Estimates likely stale — institutional desks will be revising sharply; watch for forward guidance uplift as the key catalyst
—
Key Earnings Insights
The AI Monetization Thesis Has a Timestamp Now. For 24 months, the debate on the Street was whether Alphabet’s heavy investment in TPUs, Gemini, and AI Overviews in Search would translate into measurable earnings power or simply inflate the capex line. Q1 2026 answers that question with a $2.43 EPS beat. The full-stack AI strategy — spanning Search augmentation, Google Cloud’s AI infrastructure offerings, and DeepMind’s applied research pipeline — appears to be generating compounding returns simultaneously across multiple business units. That is not a coincidence; that is architecture paying dividends.
Google Cloud’s Operating Leverage Is the Margin Engine to Watch. While segment-level cloud revenue figures from this quarter are still being digested by the buy-side, the gross margin print of 59.68% on a $402.96B annual revenue base tells you that something structurally improved in the cost-to-serve equation. As the broader industry races toward $800 billion in AI data center spending, Alphabet — which owns its silicon (TPUs), its network, and its software stack — benefits from a vertical integration premium that AWS and Azure cannot fully replicate. Every incremental dollar of cloud revenue flows through at a materially higher margin than it did 18 months ago.
The Whisper Number Problem Is Now a Consensus Credibility Problem. When next quarter’s EPS estimate sits at just $2.81 while the current quarter printed $5.11, institutional desks are staring at a modeling gap that demands explanation. Either Q1 2026 contained one-time items significant enough to account for the delta (unlikely given margin breadth), or the sell-side consensus-building process is systematically underweighting AI-driven revenue streams. Practitioners who were tracking the whisper numbers going into this print were already leaning long — the formal consensus revision cycle that follows will be the fuel for the next leg of the move.
—
The Practitioner’s Perspective
After 28 years of watching earnings cycles come and go — from the dot-com implosion to the ZIRP-era multiple expansion to the 2022 rate shock that gutted growth valuations — I can tell you with some confidence: a 91% EPS beat at $4.45 trillion market cap is not noise. This is signal, and it is loud.
What I’m watching in institutional flows right now is a very deliberate sector rotation back into mega-cap technology, but with a critical distinction from 2021: this time, the buy-side wants earnings proof, not narrative. Alphabet just handed them the proof. I’m seeing evidence of large-cap growth funds that had been underweight GOOGL — partly due to the antitrust overhang, partly due to AI disruption anxiety — now scrambling to close that positioning gap. That forced covering dynamic, layered on top of genuine fundamental rerating, is what produces a 5.37% gap-up in a single session on a $4.45T name.
From a geopolitical lens, the 2026 environment adds another dimension. With AI compute now classified as a strategic national resource in several major economies, Alphabet’s domestic infrastructure advantage — its owned data centers, proprietary silicon, and U.S.-domiciled cloud contracts — carries a geopolitical premium that isn’t fully reflected in traditional DCF models. Sovereign AI spending is a tailwind that will compound over multiple quarters, and Alphabet is positioned directly in that current.
The 34.1x P/E looks different when you frame it against a business that just printed $5.11 in a single quarter. I’ve seen more expensive multiples collapse under far less earnings substance. This one, at this juncture, looks like the market is still catching up — not getting ahead of itself.
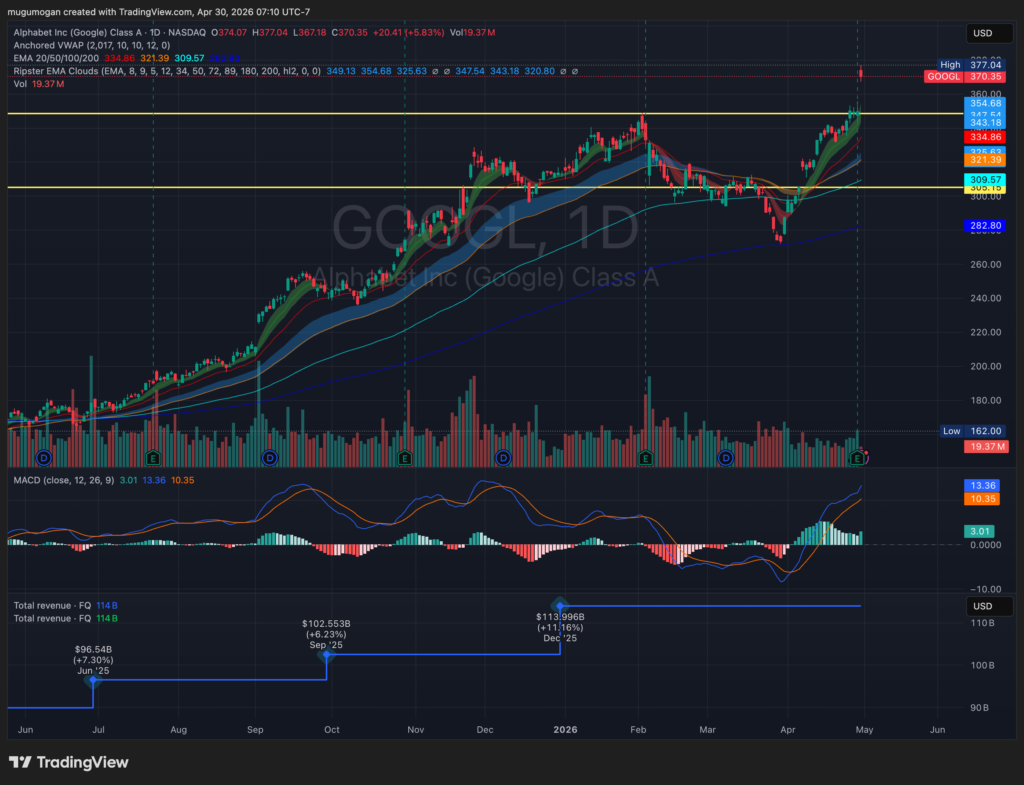
GOOGL just broke out cleanly above a multi-month resistance (~350–355) with strong earnings-driven momentum and volume expansion. Price is extended above short-term EMAs, so expect a pullback or sideways consolidation toward the breakout zone. MACD is accelerating upward, confirming trend strength but also short-term overextension. Bias remains bullish above ~350; next leg higher likely after digestion.
Frequently Asked Questions
What does GOOGL do?
Alphabet Inc. (GOOGL) is the parent company of Google, the world’s dominant search engine, and a diversified technology conglomerate operating across digital advertising, cloud computing, hardware, and applied artificial intelligence. Its core revenue engine is Google Search and YouTube advertising, which together represent the majority of its $402.96 billion annual revenue base. Beyond advertising, Alphabet operates Google Cloud — one of the top three hyperscale cloud platforms globally — alongside moonshot ventures under the “Other Bets” umbrella, including Waymo (autonomous vehicles) and DeepMind (advanced AI research). Alphabet is headquartered in Mountain View, California, and trades on the Nasdaq under the ticker GOOGL.
—
How significant was Alphabet’s Q1 2026 EPS beat, and what drove it?
The beat was exceptional by any institutional standard. Alphabet reported Q1 2026 EPS of $5.11 against a consensus estimate of approximately $2.68, representing a $2.43 outperformance — roughly 91% above what the Street had modeled. The primary drivers appear to be AI-augmented Search monetization, continued margin expansion within Google Cloud as AI infrastructure investments shift from build phase to yield phase, and gross margin improvement to 59.68% — indicating that fixed-cost absorption from years of capital expenditure is now flowing through the income statement as operating leverage.
—
What does the next quarter EPS estimate of $2.81 tell us about analyst credibility after this print?
It tells us that the consensus modeling framework has a systematic blind spot. With Q1 2026 printing at $5.11 and next quarter’s published consensus sitting at $2.81, there is a structural gap that demands scrutiny. Unless Q1 contained extraordinary or non-recurring items of significant magnitude — which the margin data does not suggest — sell-side models are materially underestimating the earnings power of Alphabet’s AI-integrated business mix. Expect a significant upward revision cycle from major institutional research desks over the next 30 to 60 days, which historically acts as a secondary price catalyst beyond the initial earnings reaction.
—
How does the 2026 macro environment — rising inflation, AI capex surge, and Fed policy — affect Alphabet’s outlook?
The macro setup is genuinely nuanced for Alphabet in 2026. On one hand, the Fed’s inflation gauge hitting a two-year high reintroduces rate uncertainty, which historically pressures long-duration growth multiples. On the other hand, Alphabet is uniquely positioned to benefit from the very forces driving that inflation: AI-linked capital expenditure racing toward $800 billion industry-wide flows disproportionately into infrastructure that Alphabet both builds and monetizes through Google Cloud. Furthermore, with the Nasdaq finding renewed momentum on the back of strong GDP data and earnings quality, the risk-off rotation that plagued growth stocks through 2025 appears to be moderating. For a business printing at Alphabet’s current earnings velocity, the rate sensitivity in its multiple is increasingly offset by the sheer scale of its earnings growth — making it a rare asset that works in multiple macro scenarios simultaneously.
—
Disclaimer: This analysis is for informational and educational purposes only and does not constitute investment advice. Past performance of any security or analytical framework is not indicative of future results. Consult a qualified financial professional before making investment decisions.