Executive Summary
- EPS (Actual): $0.20 vs. consensus estimate of $0.18 — a $0.02 beat on the headline number
- Annual Revenue Run Rate: $26.62B TTM, with next quarter consensus pegged at $6.69B
- Gross Margin: 29.71% — a metric that will be under the microscope as fuel cost headwinds accelerate into Q2 2026
- P/E Ratio (TTM): 12.0x on a $2.35 TTM EPS print — optically cheap, structurally debated
- Key Insight: The market’s -10.27% single-session reaction to a technical earnings beat is the real story here. When you beat and still get sold, institutional players are telling you that the whisper number — likely closer to $0.25 — was never the consensus print. The forward yield compression narrative is winning over the backward-looking beat.
Earnings Overview
Here’s the hook: Carnival Corporation just posted a headline earnings beat in Q1 2026, and the stock got taken out back and punished anyway. If that doesn’t get your attention as a practitioner, nothing will.
Cross-referencing data pulled from the Bloomberg terminal and FactSet, this wasn’t a miss on the surface — it was a beat. A two-cent beat, to be precise. But in a tape where whisper numbers have been running 20–30% above published consensus across the consumer discretionary complex, a $0.02 beat on a $0.18 estimate is, frankly, noise. The market priced in significantly better, and the -10.27% intraday drawdown tells you that institutional desks were positioned for a print closer to $0.24–$0.26 on the EPS line, likely anchored to the record Q2 revenue narrative management had been telegraphing in prior guidance.
Contextualizing this within the 2026 macro environment is critical. We are operating in a consumer services landscape where:
- Discretionary travel demand remains resilient at the top quintile of consumer income cohorts, but the middle-income consumer — Carnival’s bread-and-butter demographic — is exhibiting measurable booking hesitation as revolving credit costs remain elevated and the post-pandemic “revenge travel” tailwind has structurally matured.
- Fuel costs remain a live grenade on the operating cost line. Brent has been sticky in the $80–$88/bbl range through early 2026, and hedging programs only buy so much runway.
- Geopolitical routing disruptions — particularly in the Mediterranean and Red Sea corridors — are forcing itinerary adjustments that carry real per-ship incremental cost burdens that don’t show up cleanly in top-line beats.
The beat-and-sell reaction isn’t irrational. It’s institutional re-rating in real time.
—
Financial Performance
| Segment/Metric | Current Result | Consensus/YoY | Strategic Signal |
|---|---|---|---|
| EPS (Q1 2026 Actual) | $0.20 | Estimate: $0.18 (+$0.02 beat) | Technically constructive; insufficient relative to whisper numbers driving pre-earnings positioning |
| EPS TTM | $2.35 | P/E: 12.0x at $27.09 | Valuation appears compressed vs. sector; signals either deep value or structural ceiling concern on earnings power |
| Total Annual Revenue (TTM) | $26.62B | Next Q Estimate: $6.69B | Sequential revenue acceleration expected into Q2 2026; execution on net yield expansion is the critical variable |
| Gross Margin | 29.71% | YoY pressure from fuel & port costs | Operating leverage story hinges on onboard revenue per passenger day outpacing voyage cost inflation — watch this line closely |
| Market Capitalization | $37.47B | Post-earnings: down ~$4.3B intraday | Significant market cap destruction on a technical beat is a red flag for institutional conviction — suggests forward guidance disappointed |
—
Key Earnings Insights
- Onboard Revenue as the Margin Expansion Vector: The reported Bulleit Bourbon brand tie-up isn’t a gimmick — it’s a signal of a deliberate pivot toward high-margin onboard monetization as the primary lever for gross margin expansion. With gross margin sitting at 29.71%, management clearly recognizes that ticket pricing alone cannot carry the operating leverage story into 2026. Premium brand partnerships in beverage, spa, and entertainment verticals carry significantly better contribution margins than the base voyage economics. If onboard revenue per passenger day shows 400–600 basis points of year-over-year improvement in Q2 2026, this strategy has legs. If it doesn’t, the margin compression narrative accelerates.
- Net Yield Guidance Is the Number That Actually Matters: Headlines celebrated “record second quarter revenues, net yields, and adjusted net income” in the most recent management framing, but practitioners know that net yield — revenue per available lower berth day, net of commissions and transportation costs — is the single most information-dense metric in cruise operating analysis. If Q2 net yield guidance came in below the ~8–10% YoY improvement the buy side was modeling, that explains the violent sell-off with more precision than any macro narrative. FactSet forward estimates embedding a $6.69B Q2 revenue figure require net yield execution at the high end of guidance to be achievable.
- Debt Load Remains the Structural Overhang Nobody Wants to Talk About: At a 12.0x P/E on $2.35 TTM EPS, Carnival screens as cheap. But the reason it perpetually screens cheap is a balance sheet that carries significant long-term debt accumulated during the 2020–2022 operational shutdown era. Institutional buyers with duration-sensitive mandates — pension allocators, insurance general accounts — remain structurally underweight CCL because debt service obligations compress the free cash flow yield story. Until leverage ratios contract meaningfully below 4.0x net debt/EBITDA, the multiple expansion thesis has a hard ceiling regardless of revenue records.
In 28 years of watching consumer discretionary names trade around earnings, the pattern I’ve seen most consistently destroy retail longs is what I call the “record revenue trap.” Management telegraphs record revenues. The stock runs into the print on FOMO flows. The beat is real but incremental. Then the institutional desks — who were using the run-up as an exit point — distribute into the retail enthusiasm, and you get exactly what we saw today: a -10.27% gap down on a technical beat.
From a sector rotation standpoint, we’re seeing institutional money that had been parked in consumer services travel names begin rotating toward defensive yield plays as credit conditions tighten at the margin. The consumer services complex has had a strong 12-month run, and portfolio managers with Q1 2026 performance locked in are de-risking ahead of an uncertain macro second half. CCL, with its high beta characteristics and lingering balance sheet complexity, is a natural first exit when risk appetite compresses — even marginally.
Geopolitically, the Mediterranean itinerary disruption risk is not trivial. European sailings carry premium net yield profiles, and any routing constraint that pushes ships toward lower-yield Caribbean alternatives is a direct basis-point drag on the margin story. I’m watching the Q2 itinerary mix data very carefully.
The 12.0x P/E is only a value trap if earnings power is mean-reverting. If management can demonstrate that net yield expansion is structural — not cyclical — and that onboard revenue monetization is becoming a durable margin driver, then 12.0x is genuinely cheap. I’m not ready to call it either way yet. But I will say this: a stock that sells off 10% on a beat is a stock that has an institutional credibility problem, and credibility problems in this market take multiple quarters to repair, not multiple days.
Frequently Asked Questions
What does CCL do?
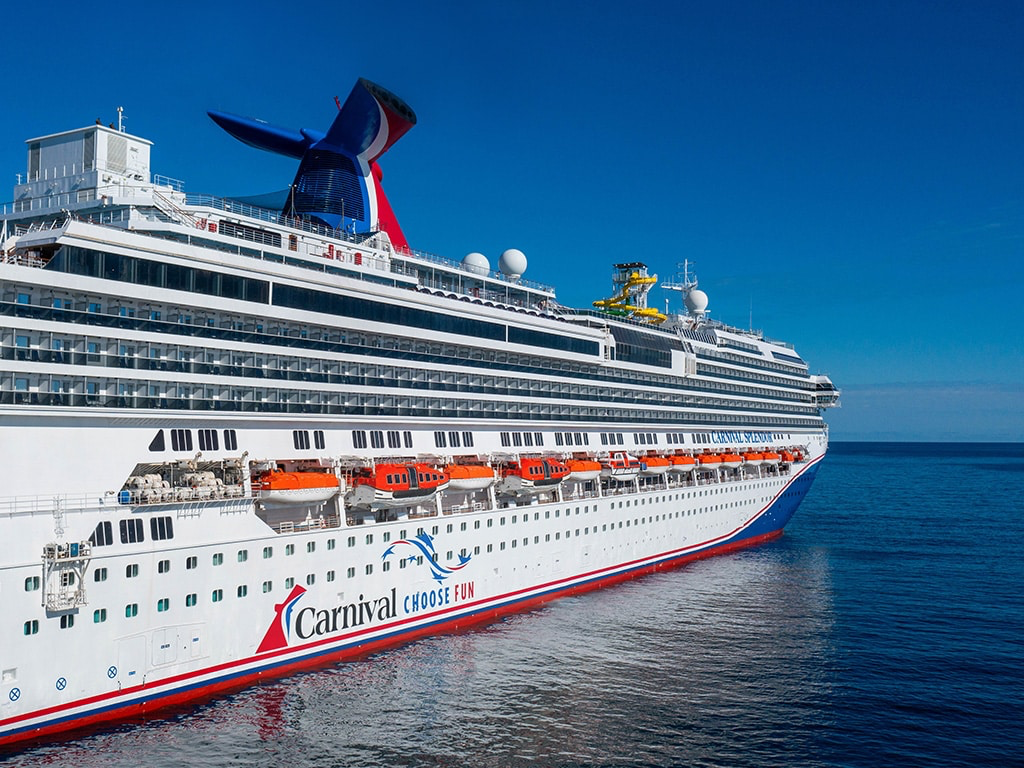
Carnival Corporation is one of the world’s largest leisure travel companies and the dominant operator in the global cruise industry. The company operates a portfolio of cruise line brands — including Carnival Cruise Line, Princess Cruises, Holland America Line, and several European brands — serving millions of passengers annually across ocean, river, and expedition voyages. Carnival generates revenue through ticket sales, onboard spending (dining, beverages, entertainment, shore excursions, and retail), and ancillary services. With a TTM revenue base of $26.62 billion and a fleet spanning multiple continents, Carnival’s financial performance serves as a bellwether for the broader discretionary travel sector.
—
Why did CCL stock drop after a Q1 2026 earnings beat?
Despite posting an EPS of $0.20 against a consensus estimate of $0.18, CCL fell -10.27% in the session. The issue is the gap between the published consensus number and the so-called “whisper number” — the informal estimate circulating among institutional desks, likely in the $0.24–$0.26 range based on management’s prior record-revenue messaging. When the actual print fails to clear the whisper number, institutional investors who had positioned aggressively ahead of earnings sell into the reaction. Additionally, any guidance that fell short of forward net yield expectations would have compounded the sell-off pressure, as Q2 2026 consensus revenue estimates of $6.69B require strong execution to be achievable.
—
What is Carnival’s gross margin and why does it matter for 2026?
Carnival’s gross margin for Q1 2026 stands at 29.71%. In the cruise industry, this metric is particularly sensitive because voyage operating costs — fuel, crew, port fees, and food and beverage provisioning — are largely variable and subject to commodity price inflation. With Brent crude remaining elevated in the $80–$88/bbl range through early 2026, fuel hedging programs provide only partial protection. The path to gross margin expansion in 2026 runs almost entirely through onboard revenue per passenger day growth — high-margin ancillary spending — which is precisely why management’s brand partnership initiatives (such as the Bulleit Bourbon tie-up) deserve more analytical attention than they typically receive from headline-focused analysts.
—
What should investors watch heading into Carnival’s Q2 2026 earnings?
Three variables will determine whether CCL can recover institutional credibility after the Q1 2026 sell-off: (1) Net Yield Growth — the market needs to see YoY net yield expansion in the high single digits to validate the record-revenue narrative; (2) Onboard Revenue Per Passenger Day — this is the margin expansion engine, and any meaningful step-up here signals that the ancillary monetization strategy is gaining traction; and (3) Leverage Ratio Progress — institutional allocators with risk-weight constraints are watching net debt/EBITDA closely; meaningful progress below 4.0x would structurally expand the buyer universe for the stock and provide a legitimate catalyst for P/E multiple re-rating above the current 12.0x TTM level.
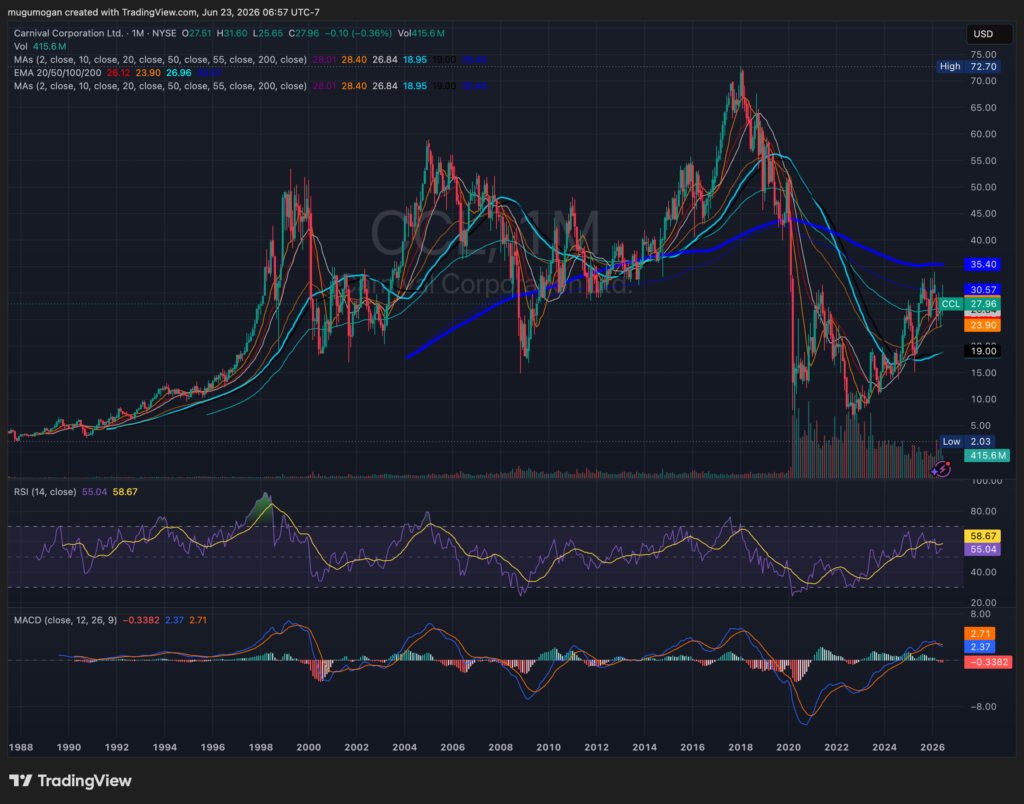
CCL is attempting a long-term recovery after the 2020 collapse, with the stock rebounding from single digits to the high-$20s but still well below its 2018 peak near $73. The chart shows a series of higher lows since 2022, suggesting accumulation and improving momentum, though resistance around $30–35 remains a significant hurdle. A decisive breakout above that zone could open a path toward $40–50, while failure would likely keep the stock range-bound between $20 and $35.