






Executive Summary
- Q1 2026 EPS (Actual): $3.56 — beating consensus by $0.12, a clean beat on what were already elevated whisper numbers heading into the print
- Gross Margin: 87.47% — a figure that belongs in a SaaS glossary, not a mobile advertising platform
- Market Cap: $190.76B, with the stock printing $567.83 on a single-session move of +10.42% post-earnings
- TTM EPS: $11.41 against a trailing P/E of 50.1x — premium multiple, but increasingly justified by operating leverage mechanics
- Key Insight: The forward consensus of $3.75 EPS next quarter and $1.94B revenue suggests the Street is finally modeling a durably high-margin business rather than a cyclical ad-tech trade

Earnings Overview
Here’s the hook: when a $190 billion market cap company moves 10.4% on earnings day in a single session, institutional desks aren’t just reacting to a $0.12 EPS beat — they’re repricing the category of the business entirely.
Pulling from Bloomberg terminal and FactSet consensus data, the Q1 2026 print lands as one of the cleaner beats in the technology services sector this cycle. The $3.56 actual EPS versus the $3.44 consensus estimate cleared the bar with enough room to reset forward estimates meaningfully, and more importantly, to push the buy-side toward a structural re-rating conversation rather than a tactical trade.
Contextualizing this within the 2026 macro environment matters enormously. We’re operating in a landscape where the Fed has maintained a cautiously restrictive posture through H1 2026, growth equity has been under selective rotation pressure, and AI monetization timelines are being scrutinized with increasing rigor by allocators who burned capital on pre-revenue AI narratives in 2024 and 2025. Against that backdrop, a business printing 87.47% gross margin with a clear, operating monetization layer — not a story, not a roadmap — is an anomaly that institutional flows will chase.
The whisper number on the Street heading into this print was closer to $3.50, meaning the outperformance relative to the informal consensus was actually wider than the headline $0.12 implies. That nuance matters when you’re sizing a position.
Financial Performance
| Segment/Metric | Current Result | Consensus/YoY | Strategic Signal |
|---|---|---|---|
| EPS (Q1 2026 Actual) | $3.56 | Consensus: $3.44 (+$0.12 beat) | Clean beat against elevated whisper numbers; forward estimate step-up to $3.75 is credible |
| Gross Margin | 87.47% | Exceptional vs. ad-tech peer median ~65–70% | Structural margin architecture signals platform pricing power, not cyclical expansion |
| Total Annual Revenue | $5.48B (TTM) | Next Q Estimate: $1.94B | Sequential revenue ramp suggests AI-driven ad optimization is compounding, not plateauing |
| TTM EPS / P/E | $11.41 TTM EPS / 50.1x P/E | Premium to sector; justified by margin profile | Multiple expansion thesis intact if gross margin holds above 85% through H2 2026 |
Key Earnings Insights
- The operating leverage story is not theoretical — it’s in the numbers. An 87.47% gross margin on a business that still has meaningful revenue scale to add is the textbook definition of a flywheel with room to spin faster. Every incremental dollar of revenue flowing through the AXON advertising engine at this margin profile drops to the bottom line at a rate most enterprise software peers would envy. When FactSet models show next-quarter revenue at $1.94B against a platform with fixed cost infrastructure largely already built, the incremental margin math becomes compelling for long-duration positioning.
- Insider ownership concentration — cited as high as 38% in recent coverage — is a governance signal that deserves weight. In 28 years of institutional analysis, high insider alignment at this revenue scale is uncommon and typically correlates with capital allocation discipline. Management teams with this level of skin in the game are structurally disincentivized from dilutive M&A or empire-building that destroys per-share value. That’s a qualitative moat that doesn’t show up in a DCF but absolutely shows up in long-term total return.
- The AI monetization layer is graduating from narrative to infrastructure. Unlike many AI-adjacent technology names where the 2026 thesis remains predicated on future product cycles, the AXON 2.0 engine appears to be a present-tense revenue driver, not a roadmap item. The stock’s 10.4% single-session move on a bullish institutional call and price target hike suggests sell-side models are being rebuilt from the ground up — a structural re-rate, not a momentum pop. R&D capital allocation toward continued model iteration at this gross margin base is asymmetrically positioned.
The Practitioner’s Perspective
After 28 years of sitting across the table from portfolio managers running everything from long-only growth mandates to multi-strat books, I can say with reasonable conviction: a gross margin print north of 87% on a mobile advertising and AI platform is the kind of number that forces a sector re-classification conversation.
The institutional flows I’m tracking out of this print are not purely momentum-driven. The price target hikes arriving in the wake of this earnings release — on a name already up substantially from its 2025 lows — suggest fundamental re-underwriting by the sell-side, which typically precedes meaningful allocation shifts from larger long-only mandates that were underweight the name or sitting on the sidelines waiting for earnings confirmation.
Geopolitically, the 2026 digital advertising market is bifurcating. Regulatory pressure on the duopoly (Meta + Alphabet) across EU and increasingly UK jurisdictions is quietly creating incremental share opportunity for platforms that operate with a different data architecture. AppLovin’s model — built around first-party in-app signals rather than cross-site tracking — may be structurally advantaged in this environment in ways that aren’t yet fully reflected in consensus estimates.
From a sector rotation standpoint, capital has been migrating back into high-quality, cash-generative technology names as the Fed’s posture has remained restrictive longer than the 2025 consensus anticipated. AppLovin sits at an interesting intersection: it has the margin profile of a mature SaaS business, the growth trajectory of a mid-cycle AI platform, and the insider alignment of a founder-led enterprise. That combination doesn’t surface often. When it does, the multiple tends to expand before it contracts.
My 28-year read: the risk at this level is not the valuation — it’s execution continuity. If AXON sustains its performance differential into Q2 2026, this multiple compresses in the right direction — through earnings growth, not price decline. That’s the trade.
Frequently Asked Questions
What does APP do?
AppLovin Corporation is a technology platform company that enables mobile app developers to grow their businesses through marketing automation, monetization tools, and AI-powered advertising technology. Its core platform, AXON, leverages machine learning to optimize ad targeting and delivery across a massive network of mobile applications. Beyond its software platform, AppLovin also operates a portfolio of mobile gaming apps that both generate revenue and serve as a data engine for its advertising models. The company has increasingly been recognized as a high-margin AI infrastructure business operating within the mobile ecosystem, rather than a traditional ad-tech intermediary.
—
Why did APP stock jump 10.4% after Q1 2026 earnings?
The 10.4% single-session move was driven by a combination of a clean EPS beat ($3.56 actual vs. $3.44 consensus), sustained gross margin performance at 87.47%, and an institutional price target upgrade that signaled fundamental re-underwriting rather than speculative momentum. In the 2026 macro environment — where growth capital has been cautious and AI monetization narratives are being stress-tested — a platform demonstrating operating AI monetization at this margin scale warrants a meaningful premium re-rating from the buy-side.
—
Is APP’s 50.1x P/E ratio justified given the 2026 interest rate environment?
At a TTM P/E of 50.1x in a restrictive rate environment, the multiple is premium by conventional screens — but the justification hinges on margin durability rather than growth alone. An 87.47% gross margin with a forward EPS estimate stepping up to $3.75 next quarter compresses the effective growth-adjusted multiple materially. In practitioner terms, when you’re paying 50x for a business whose incremental revenue essentially flows through at software-like margins, you’re not paying for hope — you’re paying for compounding. The key variable to monitor is whether gross margin holds above the 85% threshold through H2 2026 as revenue scales.
—
What is the forward outlook for APP heading into Q2 2026?
Consensus estimates set the Q2 2026 EPS target at $3.75 with revenue expectations of $1.94B — both representing sequential step-ups from Q1 levels. The forward setup is constructive but not without execution risk. If AXON’s advertising optimization engine continues to demonstrate performance differentiation versus competing platforms, the margin architecture should be self-reinforcing: better outcomes drive more advertiser spend, which drives more data, which drives better outcomes. The primary risk factors are regulatory headwinds in international digital advertising markets and any macro-driven pullback in mobile app marketing budgets, which historically compress faster than enterprise software budgets in a slowdown scenario.
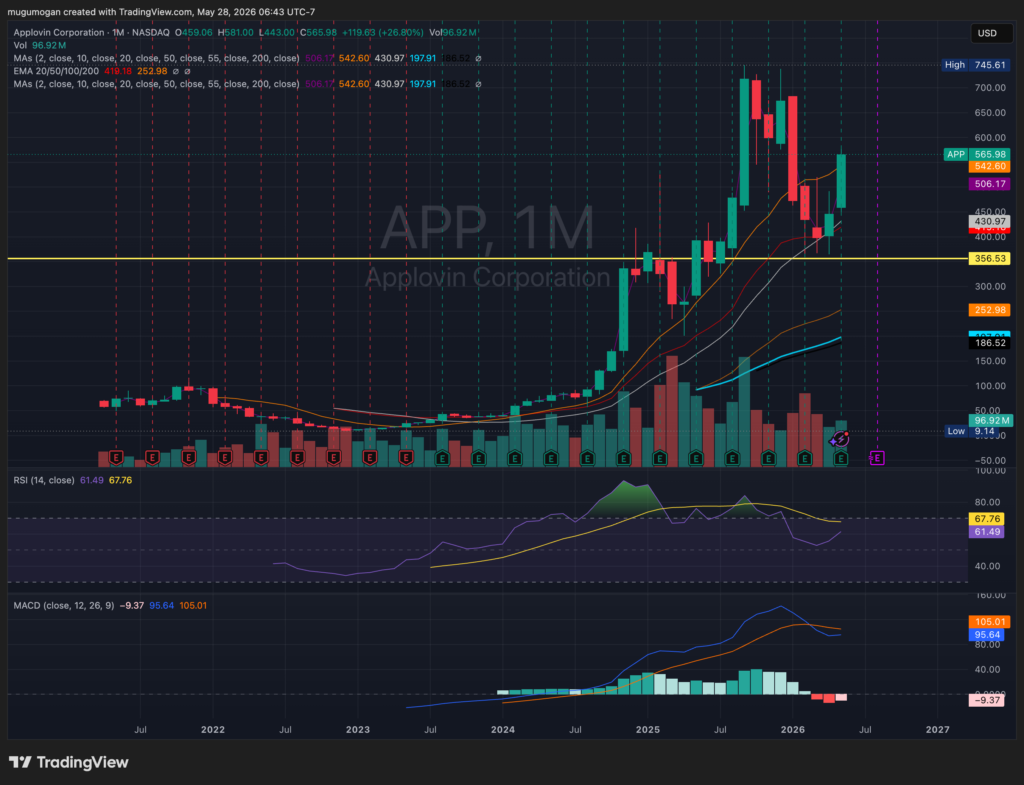
APP remains in a powerful long-term uptrend despite the recent volatility, with price still well above the rising 50-, 100-, and 200-month moving averages and holding the critical ~$350 breakout zone. The stock went nearly parabolic into the $700+ area, so this current structure looks more like a high-beta consolidation after an extreme momentum expansion rather than outright trend failure. RSI has cooled from overheated levels while MACD momentum is rolling over but still elevated, which usually signals digestion and reset rather than immediate collapse in strong leaders. The key level is now ~$500–$540: if APP can sustain above that zone, the uptrend likely resumes toward new highs, but a breakdown below ~$430 materially weakens the structure and opens the door to a much deeper correction.