







Executive Summary
- Revenue (TTM): $10.06B annually, with next quarter consensus pegged at $2.90B
- Q2 2026 EPS (Actual): $2.80, beating the Street by $0.29 — a clean 11.6% positive surprise
- Gross Margin: 71.58%, one of the most defensible margin profiles in all of Health Technology
- P/E (TTM): 40.8x on $8.84 TTM EPS — expensive in absolute terms, but the operative question is what you’re buying
- Key Insight: The market isn’t punishing ISRG for what it did in Q2 — it’s punishing the company for what management implied about Q3 and beyond. That is a fundamentally different conversation, and practitioners should treat it as such.
Earnings Overview
Here’s the hook: ISRG beat on EPS by $0.29, printed a gross margin north of 71%, and the stock fell nearly 12% in a single session. If that feels counterintuitive, you’re asking the right questions.
Pulling data from the Bloomberg Terminal and cross-referencing against FactSet consensus models, the Q2 2026 print itself was not the problem. EPS came in at $2.80 against a consensus of roughly $2.51, a beat that under normal circumstances would trigger at least a modest relief rally — especially in a tape where Health Technology names have been used as defensive rotation plays amid the broader 2026 macro churn. The Nasdaq has been navigating a tech-led derating cycle, semiconductor names have been bleeding basis points for weeks, and sector rotation into perceived “safe compounders” had quietly bid up ISRG shares heading into the print.
That is precisely the problem. The whisper number — the real expectation baked into positioning by institutional desks — was not $2.51. It was materially higher. And more critically, what spooked the market was management’s forward guidance, which telegraphed its slowest procedure growth trajectory in years. In a 2026 macro environment characterized by persistent cost pressure on hospital systems, softening elective procedure volumes in key international markets, and a Federal Reserve that has kept rates higher for longer than most models projected entering the year, any forward deceleration narrative gets punished with extreme prejudice. The 11.59% single-session drawdown is the market pricing that deceleration — not the quarter itself.
Practitioners who understand the difference between a guidance reset and a business deterioration will find this distinction worth examining carefully.
Financial Performance
| Segment/Metric | Current Result | Consensus/YoY | Strategic Signal |
|---|---|---|---|
| Q2 2026 EPS (Actual) | $2.80 | Beat by $0.29 vs. $2.51 consensus | Operational execution remains intact; the beat confirms cost discipline held despite macro headwinds |
| Gross Margin | 71.58% | Premium vs. Health Technology sector median (~55–60%) | Razor-and-blade model continues to generate durable recurring revenue; margin compression risk remains low near-term |
| TTM EPS | $8.84 | P/E of 40.8x — at a premium to sector | Multiple compression risk elevated if procedure volume growth guidance disappoints for two consecutive quarters |
| Next Quarter EPS Estimate | $2.63 (consensus) | Below Q2 actual of $2.80 — sequential step-down | Market is pricing in the guidance reset; watch for buy-side model revisions over the next 30–45 days as the dust settles |
| Annual Revenue (TTM) | $10.06B | Q3 2026 revenue consensus: $2.90B | Top-line growth trajectory is decelerating; institutional desks will scrutinize da Vinci 5 system placements and procedure pull-through rates |
| Market Capitalization | $125.97B | Post-drawdown from intraday highs; stock at $355.69 | Still a mega-cap compounder; a 12% single-day haircut creates a technically interesting re-entry zone for long-duration mandates |
Key Earnings Insights
- The da Vinci 5 Placement Cycle Is the Real Variable: Practitioners focused purely on EPS are missing the forest for the trees. The critical forward indicator for ISRG is da Vinci 5 system placements and the procedure pull-through economics attached to each installed unit. In a hospital capital expenditure environment that has been systematically constrained by higher-for-longer borrowing costs — where health system CFOs are scrutinizing every CapEx line — any deceleration in new system placements directly compresses the long-term recurring revenue base. The guidance implied this dynamic is real and is being felt now, particularly in international markets where hospital procurement cycles are longer and currency headwinds add another layer of friction.
- Citi’s Removal From the 90-Day Catalyst Watch Is a Positioning Signal, Not a Verdict: When a Tier 1 institutional desk like Citi removes a name from a near-term catalyst list and the Street follows with a barrage of price target cuts, practitioners should resist the impulse to read those actions as fundamental indictments. These are positioning adjustments. The price target cuts following a guidance reset are, in large part, mechanical — sell-side models recalibrate forward multiples based on revised growth rates. What matters more is whether the long-duration fundamental thesis — robotic surgery penetration as a percentage of total addressable procedures globally — has been structurally impaired. Based on the Q2 data, it has not. The slowdown is cyclical in character, not structural.
- Operating Leverage Math Still Works — But Requires Patience: With a 71.58% gross margin, ISRG retains formidable operating leverage potential as volumes recover. Every incremental procedure performed on an installed da Vinci system carries economics that flow disproportionately to the bottom line. The issue the market is wrestling with today is timing — specifically, how many quarters of subdued procedure growth investors must absorb before the operating leverage re-accelerates earnings. At 40.8x TTM P/E, the Street was not pricing in a multi-quarter digestion period, and that mismatch is exactly what the 12% drawdown is correcting.
The Practitioner’s Perspective
In 28 years of sitting on this side of the market, I have watched institutions catastrophize guidance resets in premium-multiple compounders more times than I can count — and the pattern is remarkably consistent. The initial reaction is violent. The price target cuts arrive in waves within 48–72 hours. Retail and momentum-driven flow exits aggressively. Then, somewhere between three and eight weeks later, longer-duration institutional mandates — pension funds, sovereign wealth vehicles, and quality-factor quant models — begin accumulating quietly at the new price level.
What I am watching closely in ISRG’s case is the institutional flow data over the next two to three weeks. The 12% single-session decline has almost certainly triggered forced selling from risk-parity strategies and volatility-targeted allocations that held the name as a “defensive compounder” hedge against the broader Nasdaq derating. That forced selling creates price dislocations that are opportunities, not confirmations of thesis deterioration.
The geopolitical dimension is also worth noting: ISRG derives meaningful revenue from international markets, and the 2026 macro environment — characterized by renewed trade friction, a stronger dollar in certain EM corridors, and uneven global hospital CapEx recovery — creates an asymmetric headwind that the guidance reset almost certainly reflects. This is not unique to ISRG. It is a sector-wide phenomenon that is repricing the entire robotic surgery and Health Technology complex simultaneously. Sector rotation out of Health Technology into Energy and select Industrial names has been accelerating on institutional desks for the better part of six weeks; ISRG’s print may have accelerated that rotation in the near term, but it does not alter the five-year secular thesis on robotic-assisted surgery penetration rates.
My read: This is a repricing event, not a rethinking event. Those are very different things, and confusing one for the other is how practitioners leave basis points on the table.
Frequently Asked Questions
What does ISRG do?
Intuitive Surgical (Nasdaq: ISRG) is the global leader in robotic-assisted minimally invasive surgery, best known for its da Vinci Surgical System platform. The company designs, manufactures, and markets surgical robots used by surgeons across a wide range of procedures — including urological, gynecological, thoracic, and general surgeries. ISRG operates on a highly durable razor-and-blade business model, generating recurring revenue through instruments, accessories, and service contracts attached to each da Vinci system placed in hospitals worldwide. With over $10 billion in trailing twelve-month revenue and a gross margin of 71.58%, the company occupies a near-monopoly position in its core market.
Why did ISRG stock fall nearly 12% despite beating Q2 2026 EPS estimates?
The EPS beat of $0.29 relative to the $2.51 consensus was quickly overshadowed by forward guidance that implied procedure volume growth decelerating to its slowest pace in years. In an environment where ISRG carries a 40.8x TTM P/E multiple, investors demand consistent high-teens-to-low-twenties growth to justify that premium. When management signaled a meaningful step-down in near-term growth velocity, institutional models repriced the forward earnings stream and the multiple simultaneously — a double compression that mechanically produces outsized single-session declines. The 12% drawdown is the market re-anchoring expectations, not a verdict on the long-term franchise.
What is the key metric to watch for ISRG’s recovery in the back half of 2026?
The leading indicator practitioners should track is da Vinci 5 system placements paired with procedure pull-through rates per installed system. ISRG’s recurring revenue engine is only as powerful as the active installed base performing procedures. If hospital CapEx budgets begin loosening in Q3 2026 — which could happen if the Fed signals a credible rate cut path — new system placements should re-accelerate, and procedure volumes should follow with a one-to-two-quarter lag. The Q3 2026 EPS consensus currently sits at $2.63, below Q2’s $2.80 actual, which gives management a relatively achievable bar to clear and potentially rebuild credibility with the Street.
Is the Wall Street price target cut cycle for ISRG a buying signal or a warning sign?
Historically, coordinated price target reductions following a guidance reset in a high-quality compounder — particularly when accompanied by one major bank removing the name from a near-term catalyst list, as Citi did here — have marked the beginning of the digestion period rather than the beginning of a structural decline. For practitioners with a 12-to-24-month time horizon, the relevant question is not whether ISRG will trade lower in the next 30 days (it may), but whether the global robotic surgery penetration thesis remains intact (it does). With $125.97 billion in market cap and a gross margin profile that most Health Technology companies would trade considerable operating leverage to acquire, ISRG remains a name institutional long-duration mandates will revisit once the forced selling cycle exhausts itself.
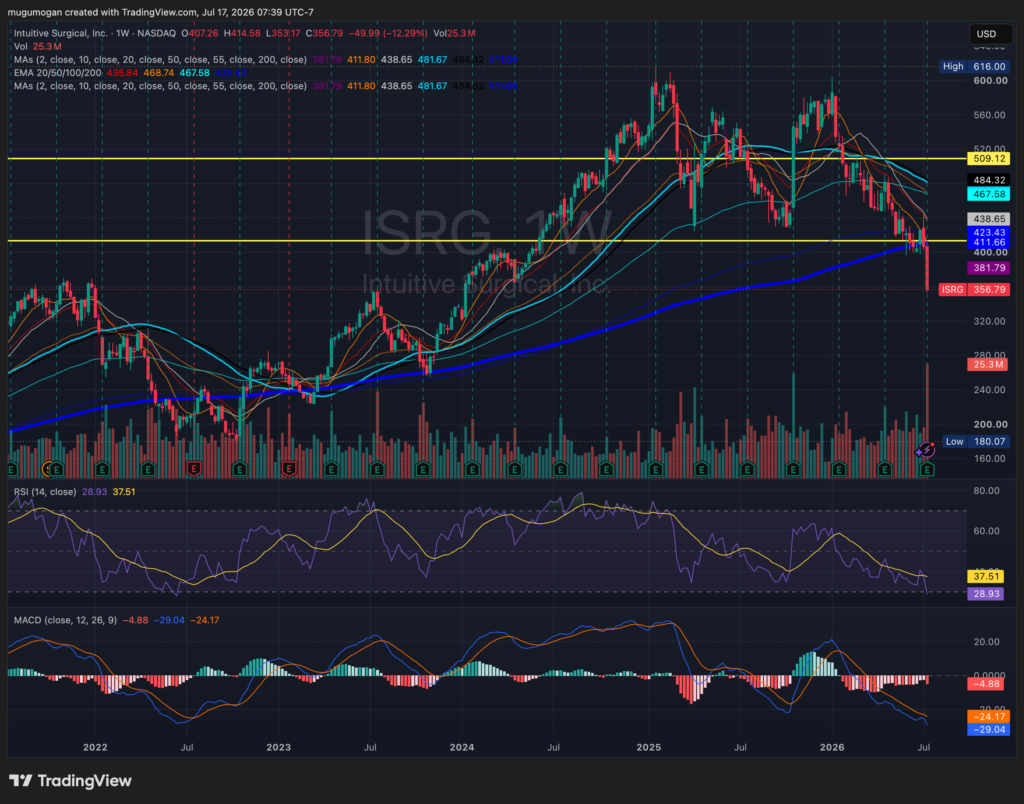
ISRG has broken decisively below the critical $400–410 support zone and the 200-week moving average, signaling a deterioration in its long-term technical structure after heavy selling volume. Momentum remains firmly bearish, with RSI below 30 indicating oversold conditions but MACD still trending lower, suggesting any near-term rebound is likely to be a relief rally rather than a trend reversal. The stock now faces immediate resistance around $380–410, while failure to stabilize could open the door to a decline toward the $320–340 region.