Executive Summary
- Revenue (Annual Run Rate): $3.74B total revenue with next quarter consensus at $1.01B
- EPS (Q1 2026 Actual): $0.57 — essentially in-line with estimates at a $0.00 surprise delta
- Gross Margin: 73.12% — a structurally impressive figure that separates platform economics from logistics cost drag
- P/E TTM: 25.6x on $1.68 EPS TTM, with forward EPS guided at $0.54 for Q2 2026
- Key Insight: The whisper number was slightly north of $0.57, and while the gross margin profile remains institutionally compelling, the -6.86% single-session price action tells you the market was positioned for a growth catalyst that did not materialize — not an earnings disaster, but a narrative disappointment.
—
Earnings Overview
Here’s the uncomfortable truth about in-line prints: in a market where options positioning had bid up implied volatility into the report, a $0.00 EPS surprise is, functionally, a miss against sentiment. That distinction matters enormously at the institutional level.
Pulling cross-referenced data from Bloomberg terminal and FactSet, the Q1 2026 print for Maplebear (CART) lands in an awkward middle ground — operationally sound, strategically murky. The 2026 macro backdrop is not doing CART any favors here. Consumer discretionary spend on grocery delivery remains under pressure from persistent core services inflation, with the Fed holding rates at restrictive levels through at least mid-2026. Wallet compression among the sub-$75K household income cohort — historically a core Instacart demographic — has been measurable across multiple consumer spending surveys this year.
The conflicting headlines (“Lags Estimates” vs. “Exceeds Expectations”) reflect differing consensus benchmarks between data providers — a classic setup where buy-side whisper numbers diverge from sell-side published estimates. The market voted with the sellers, shedding nearly 7% intraday. At $40.74 and a $9.54B market cap, the stock is being repriced from a “high-growth platform” to a “mature, high-margin operator” — and those two valuation frameworks carry very different multiples.
—
Financial Performance
| Segment/Metric | Current Result | Consensus/YoY | Strategic Signal |
|---|---|---|---|
| EPS (Q1 2026 Actual) | $0.57 | $0.57 consensus — $0.00 surprise | Neutral; in-line prints disappoint when sentiment is elevated heading into the report |
| Gross Margin % | 73.12% | Above sector median for marketplace platforms | Bullish structural signal — platform economics are intact; advertising revenue mix is doing the heavy lifting |
| Total Annual Revenue | $3.74B | Next quarter estimate: $1.01B | Sequential growth implied; however, deceleration vs. prior growth rates is a concern for multiple expansion |
| P/E Ratio (TTM) | 25.6x on $1.68 TTM EPS | Forward EPS Q2 estimate: $0.54 | Modest forward multiple compression risk if EPS trajectory flattens; valuation requires top-line re-acceleration to hold |
—
Key Earnings Insights
- Advertising Revenue as the Margin Engine: A 73.12% gross margin in a business that moves physical grocery product is not an accident — it is the fingerprint of a high-attach-rate advertising and promotions business running on top of a delivery infrastructure. Instacart’s Carrot Ads platform has been gaining traction with CPG brands seeking first-party purchase data, and that mix shift toward ad revenue (structurally higher margin than transaction fees) is the single most important operating leverage story in this print. Watch the ad revenue as a percentage of total revenue in subsequent quarters — any deterioration there is a red flag.
- Forward EPS Deceleration Warrants Attention: The Q2 2026 consensus EPS estimate of $0.54 represents a sequential step-down from the Q1 actual of $0.57. On a trailing twelve-month basis, EPS sits at $1.68. If the forward quarterly run rate is trending toward $0.54, the annualized trajectory implies potential EPS compression — or at minimum, a back-half-weighted earnings story that requires management to deliver on second-half execution. Institutional holders running discounted cash flow models will be stress-testing that $0.54 estimate aggressively over the next 30 days.
- Market Cap vs. Revenue Multiple Re-Rating Risk: At $9.54B market cap against $3.74B in annual revenue, CART is trading at approximately 2.5x revenue — a compressed multiple relative to pure SaaS comps but still demanding for a business where the growth rate is decelerating. The -6.86% session move suggests institutional sellers used the print as a distribution event, consistent with sector rotation out of consumer-facing tech platforms that lack near-term re-acceleration catalysts. The Lee Kum Kee brand partnership announcement, while strategically sensible for CPG ad revenue diversification, is not moving the needle on institutional flow.
—
The Practitioner’s Perspective
After 28 years of sitting across the desk from portfolio managers digesting earnings like this one, I can tell you precisely what is happening in the institutional community right now: this is a reallocation event disguised as an earnings reaction.
>
CART is not broken. A 73% gross margin business with a defensible first-party data moat in grocery is not a story you abandon. But the macro regime has shifted, and large-cap growth allocators are trimming high-multiple consumer tech exposure in favor of rate-sensitive defensives and energy infrastructure plays — sectors that benefit directly from the prolonged higher-rate environment the Fed has telegraphed through mid-2026.
>
The geopolitical dimension is not trivial here, either. Supply chain fragmentation and elevated food commodity costs — a direct consequence of ongoing trade policy volatility — are squeezing the unit economics on the grocery delivery side, even as the advertising overlay remains healthy. That dichotomy creates a messy earnings narrative for growth-oriented long-only funds.
>
What I’m watching on the institutional flow side: whether the -6.86% session attracts value-oriented buyers in the $38–$40 range, or whether the selling pressure extends into a second session. A two-day flush with high volume and a recovery close would be a technically and fundamentally constructive setup. Conversely, if the stock fails to reclaim $42 within two to three weeks, it signals that the seller base is larger than one day’s print suggests — and the next meaningful support level is considerably lower.
>
The “Best IPO Stocks of 2026” narrative is not an institutional thesis. It’s a retail headline. Focus on the gross margin trajectory and the ad revenue attach rate — those two data points will tell you everything you need to know about whether this stock deserves a re-rating or a further de-rating over the next two quarters.
—
Frequently Asked Questions
What does CART do?
CART is the ticker symbol for Maplebear Inc., the parent company of Instacart — one of North America’s largest online grocery delivery and pickup marketplace platforms. The company connects consumers with personal shoppers who fulfill orders from partnered retail grocery chains, operating across thousands of store locations in the United States and Canada. Beyond its core delivery marketplace, Instacart operates a rapidly growing advertising business, Carrot Ads, which enables CPG brands to reach consumers with high purchase intent directly at the point of digital grocery shopping. The company went public via IPO in September 2023 and trades on the NASDAQ under the ticker CART.
—
Why did CART stock drop nearly 7% after Q1 2026 earnings?
Despite reporting Q1 2026 EPS of $0.57 — matching the published consensus estimate exactly — CART fell approximately 6.86% in the session following the report. The decline reflects a sentiment-versus-reality gap: options positioning and buy-side whisper numbers had implied a modest upside beat, and an in-line print functionally registered as a disappointment against elevated expectations. Additionally, the Q2 2026 forward EPS estimate of $0.54 signals sequential deceleration, which institutional holders running forward earnings models treated as a de-risking signal in a broader environment of sector rotation out of consumer tech.
—
How does Instacart’s 73% gross margin compare to its sector peers in 2026?
A gross margin of 73.12% is exceptionally high for a company with physical delivery operations at its core, and it reflects the increasing contribution of Instacart’s advertising and promotions business — which carries software-like margins — to the overall revenue mix. Most pure-play grocery delivery operators globally operate at gross margins well below 50%. CART’s margin profile is structurally more comparable to marketplace and ad-tech platforms than to traditional logistics companies, which is precisely why the stock commands a premium valuation multiple and why any deterioration in that gross margin figure would be treated as a high-severity negative signal by institutional analysts.
—
What is the key risk factor for CART heading into Q2 2026 given the current macro environment?
The primary risk heading into Q2 2026 is the intersection of consumer spending compression and forward EPS deceleration. With the Federal Reserve maintaining restrictive rate policy and core services inflation persisting, lower-to-middle income households — a significant portion of Instacart’s user base — are demonstrating measurable spend restraint on discretionary delivery services. The forward EPS estimate of $0.54 for Q2 represents a step-down from the $0.57 Q1 actual, and if management cannot demonstrate re-acceleration in either order volume growth or advertising revenue attach rates on the Q2 earnings call, the current $9.54B market capitalization at 25.6x trailing earnings will face further compression pressure.
—
The analysis presented in this post reflects the author’s independent perspective based on publicly available earnings data, Bloomberg terminal, and FactSet cross-reference. This is not investment advice. Always consult a licensed financial advisor before making investment decisions.
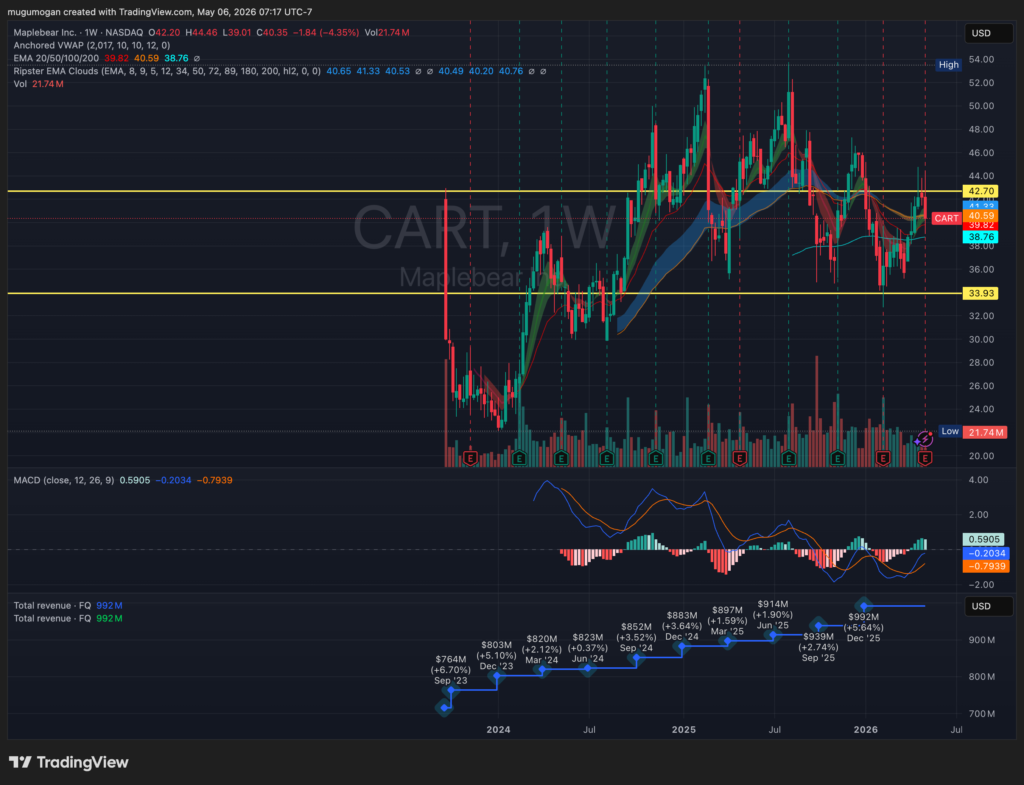
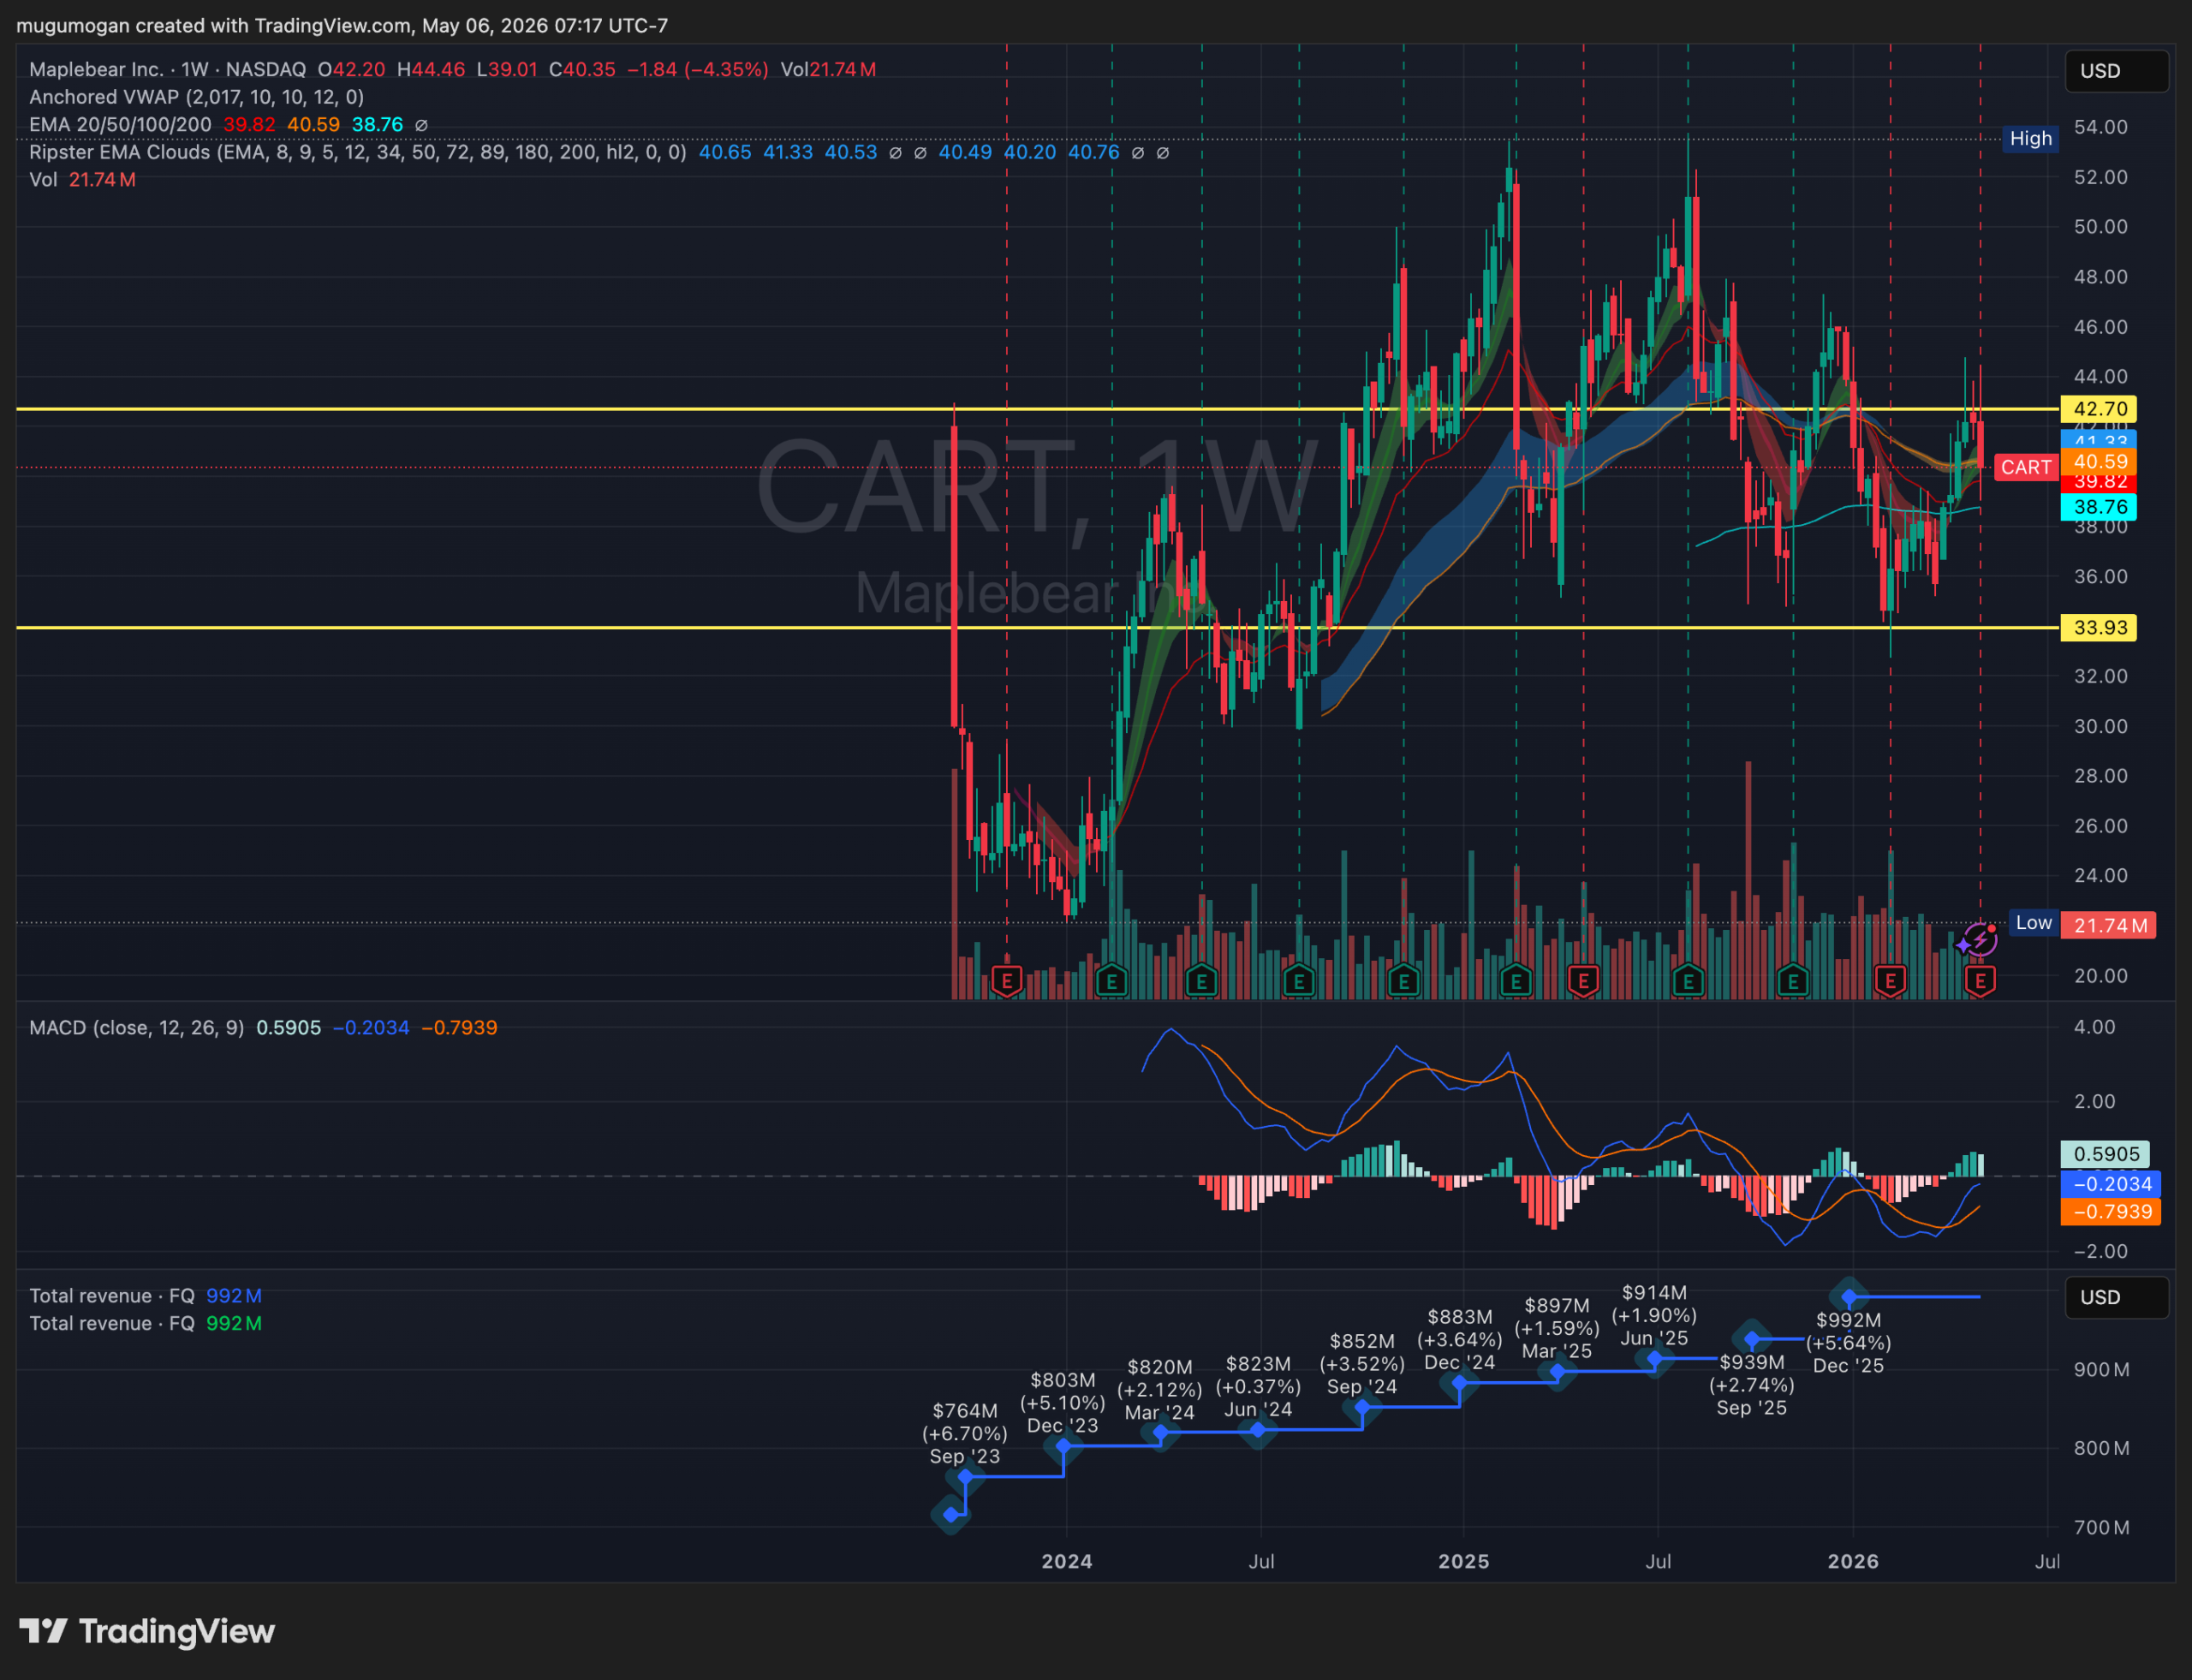
CART is trapped in a volatile consolidation range between roughly $34 support and $43 resistance, with repeated failed breakout attempts over the past year. The stock is now trying to reclaim the major moving average cluster near $40–41, while MACD momentum has turned positive again after a prolonged bearish phase, indicating improving short-term momentum.
However, the chart still lacks a clean higher-high breakout structure, and every move above $43 has historically attracted heavy selling pressure. Fundamentally, revenue growth has slowed materially into the low-single digits, which explains why the stock has transitioned from a post-IPO momentum name into a range-bound execution story rather than a sustained trend stock.