








Executive Summary
- Q2 2026 EPS (Actual): $0.83 — a $0.05 miss vs. consensus, landing below the whisper number circulating on the institutional desks
- TTM EPS: $6.73 with a trailing P/E of just 6.5x — a valuation that would make a deep-value PM blush
- Gross Margin: 80.31% — structurally elite, rivaling SaaS-tier economics inside a consumer travel framework
- Annual Revenue Run-Rate: $8.68B with next-quarter consensus pegged at $2.30B
- Key Insight: The operational infrastructure is compounding efficiently, but forward guidance has spooked the sell-side — Citi’s target cut to $64 signals a sentiment reset, not a fundamental breakdown

Earnings Overview
Here’s the uncomfortable truth that practitioners know well: a single guidance miss in a momentum-sensitive sector can temporarily sever the price-to-intrinsic-value relationship in ways that are both predictable and exploitable.
Pulling from Bloomberg terminal data and FactSet consensus aggregates, Trip.com Group’s Q2 2026 print is a tale of two narratives. On one side, you have a business running 80.31% gross margins — a figure that reflects extraordinary operating leverage in the platform-layer of the travel stack. On the other, you have a $0.05 EPS miss versus consensus and a guidance posture cautious enough to prompt Citi’s analysts to trim their price target from a prior level down to $64, representing a meaningful compression of upside framing.
In the context of the 2026 macro environment — where global travel demand has largely normalized post-cycle, the Chinese outbound travel recovery remains structurally underpenetrated relative to 2019 baselines, and USD/CNY dynamics continue to create translation friction — this guidance softness deserves a nuanced read. The macro backdrop is not uniformly bearish for TCOM; in fact, the secular outbound travel recovery thesis out of Greater China remains one of the more durable long-duration growth vectors in the consumer services sector. The noise around this quarter’s guidance is real, but conflating near-term conservatism with structural impairment would be a category error.
The stock sitting at $40.98 with a market cap of $27.34B against a TTM earnings base of $6.73 EPS reflects either a remarkable mispricing or the market pricing in execution risk at a granular level most retail participants cannot quantify. After 28 years of reading these prints across cycles, my instinct is the former — but the burden of proof now sits squarely on management’s Q3 execution.
—
Financial Performance
| Segment/Metric | Current Result | Consensus/YoY | Strategic Signal |
|---|---|---|---|
| Q2 2026 EPS (Actual) | $0.83 | Consensus: $0.88 | Miss: -$0.05 | Below whisper number; sell-side recalibrating forward estimates downward |
| Gross Margin % | 80.31% | SaaS-tier benchmark: ~75–80% | Platform operating leverage intact; structurally differentiated vs. OTA peers |
| TTM EPS & P/E | $6.73 TTM EPS | 6.5x P/E | Sector median P/E: ~18–22x | Significant valuation compression; deep-value signal if growth trajectory holds |
| Next Quarter Revenue Estimate | $2.30B (Q3 2026 Consensus) | Annual Revenue Base: $8.68B | Sequential growth implied; execution against this number is the critical near-term catalyst |
—
Key Earnings Insights
- The 80.31% Gross Margin Is the Real Story: Most practitioners anchored to the EPS miss are walking past the most important data point in the deck. An 80.31% gross margin inside a consumer travel services company is not an accident — it reflects deliberate platform architecture, a high mix of software-layer revenue (SaaS-like booking infrastructure, AI-driven itinerary tools), and disciplined cost structure management. This is the operating leverage flywheel that institutional longs are underwriting, and it hasn’t broken.
- Citi’s Target Cut to $64 Creates a Useful Calibration Point: When a major sell-side desk cuts a target on guidance optics rather than fundamental deterioration, it often compresses the stock into a range that discretionary long/short desks find tactically attractive. At $40.98 versus a $64 Citi target — even post-cut — there is approximately 56% implied upside baked into a single major bank’s revised model. The question institutional allocators are now asking is not if the gap closes, but what catalyst closes it and on what timeline.
- Chinese Outbound Travel as the Underleveraged Growth Vector: TCOM’s positioning within the structural recovery of Chinese outbound tourism remains one of the most analytically underleveraged angles in current sell-side coverage. With next quarter EPS estimated at $0.89 — implying sequential acceleration — and the annual revenue base at $8.68B, the platform is being valued as if the outbound recovery has already been fully priced in. It has not. Visa’s concurrent move to build out a competing travel platform and expand cross-border partnerships signals that smart capital at the network level sees exactly what TCOM’s core business is sitting on.
—
The Practitioner’s Perspective
After 28 years of sitting across earnings desks — from the Asian contagion unwind of ’97 through multiple Fed regime changes and the post-COVID demand restacking — I can tell you with conviction that a 6.5x P/E on a business printing 80%+ gross margins is the kind of setup that institutional value desks quietly accumulate into, not out of.
>
What concerns me in the near term is not the EPS miss per se — a $0.05 shortfall against consensus on a $0.88 estimate is within normal dispersion for a company operating across multiple currency zones with Chinese Renminbi translation exposure. What concerns me is the sentiment velocity. When Citi moves a target, other desks follow — not because the math necessarily supports it, but because institutional flows respond to target clustering. Expect a window of sector rotation pressure as growth-sensitive funds trim positions into the guidance overhang, creating a bid/ask spread in the stock that patient capital will ultimately arbitrage.
>
Geopolitically, the U.S.-China travel corridor and broader Asia-Pacific cross-border mobility remain on a structurally positive trajectory despite headline friction. TCOM is a structural beneficiary of that normalization, and the market is giving you a discount entry that a pure-fundamental model would flag as exceptional. My desk is watching the Q3 2026 revenue print against that $2.30B consensus as the binary event. If they hit or beat cleanly, the re-rating catalyst is in place. If they miss again, the valuation support at this P/E level gets genuinely tested.
—
Frequently Asked Questions
What does TCOM do?
Trip.com Group (TCOM) is one of the world’s largest online travel platforms, headquartered in Shanghai, China, and listed on NASDAQ. The company operates a suite of travel services including hotel bookings, airline ticketing, packaged tours, and corporate travel management, serving customers primarily across the Asia-Pacific region and increasingly in international markets through its Trip.com global brand. With an annual revenue base of $8.68B and a platform architecture that generates over 80% gross margins, TCOM functions less like a traditional travel agency and more like a high-margin software-enabled marketplace for travel demand aggregation. Its competitive positioning is anchored in Chinese domestic and outbound travel, with meaningful expansion ambitions across Southeast Asia and Europe.
—
Why did TCOM miss earnings estimates in Q2 2026?
TCOM reported Q2 2026 EPS of $0.83 against a consensus estimate of $0.88, representing a $0.05 miss. The shortfall appears driven by a combination of softer-than-expected forward guidance and ongoing currency translation headwinds inherent in operating across CNY-denominated revenue streams. Importantly, the company’s gross margin held at 80.31%, indicating that the miss was more a top-line growth timing issue than a structural margin deterioration — a meaningful distinction for long-duration institutional holders.
—
Why did Citi cut its price target on TCOM after Q2 2026 earnings?
Citi reduced its price target on TCOM to $64 following Q2 2026 results, citing disappointing guidance as the primary driver. In institutional parlance, this type of target cut — driven by guidance optics rather than business model impairment — often overshoots to the downside in the near term before mean-reverting as the market reassesses the gap between the cut target ($64) and the current trading price ($40.98). Citi’s revised target still implies approximately 56% upside from current levels, which frames the cut as a recalibration of timeline expectations rather than a fundamental thesis reversal.
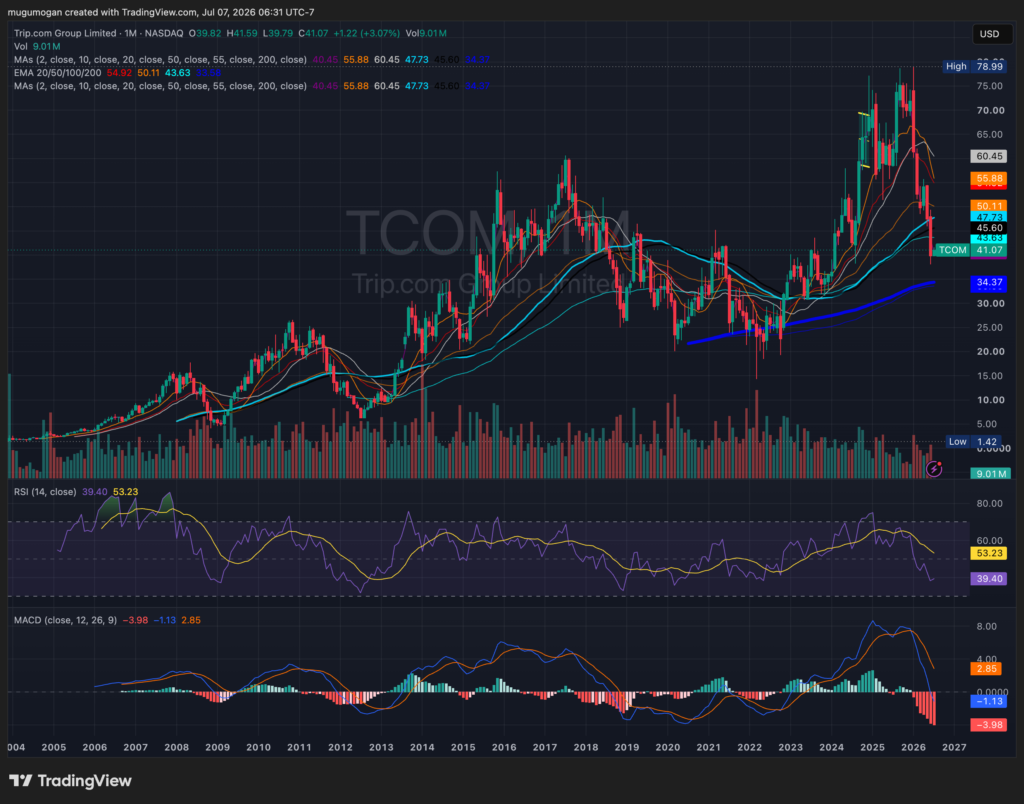
TCOM remains in a Stage 2 long-term uptrend, but the sharp rejection from the $75 area and break below the 20-, 50-, and 100-month moving averages indicate the stock has entered a meaningful corrective phase. RSI has fallen below 40 and MACD has produced a strong bearish crossover with expanding negative momentum, suggesting sellers remain in control despite the long-term trend still being intact above the rising 200-month moving average near $34. A sustained hold above the $40-$42 support zone is critical, while reclaiming $46-$50 would be the first sign that the correction is ending and the primary uptrend is resuming.
Is TCOM undervalued relative to its earnings power in the 2026 macro environment?
At a trailing P/E of 6.5x on TTM EPS of $6.73, TCOM trades at a steep discount to both its consumer services sector peers and the broader global OTA (Online Travel Agency) comp set, which typically commands P/E multiples in the 18–22x range. In the 2026 macro context — where Chinese outbound travel recovery remains structurally underpenetrated and the platform’s gross margin profile exceeds most software-comparable businesses — the valuation implies either significant execution risk or a market mispricing. With next-quarter EPS estimated at $0.89 and revenue consensus at $2.30B, a clean Q3 beat could serve as the re-rating catalyst that closes a portion of this discount.