



Executive Summary
- Q2 2026 EPS (Actual): $1.62 vs. $1.49 consensus — a $0.13 beat that cleared both the whisper number and the published estimate
- Gross Margin: 71.41% — a structural indicator of pricing power that most mid-cap software peers would envy at scale
- Trailing Twelve-Month EPS: $2.10, implying a P/E of 18.6x — materially compressed relative to sector comps
- Market Cap: $1.58B on $978M in annual revenue — a price-to-sales ratio barely north of 1.6x in a sector where 4–6x is routine
- Key Insight: The market’s -1.89% reaction on earnings day is a classic “sell the news” technical flush, not a fundamental repudiation. When you run 71-handle gross margins at this revenue scale and still trade at a single-digit premium to book, institutional re-rating is a matter of when, not if
Earnings Overview
Here’s the hook: Progress Software just delivered a beat that most enterprise software companies would frame in a press release with three exclamation points, and the stock opened down nearly two percent. If that asymmetry doesn’t sharpen your attention, you’re reading the wrong blog.
Cross-referencing data pulled from the Bloomberg Terminal and FactSet consensus models, the $1.62 print against a $1.49 estimate represents an 8.7% positive earnings surprise — well above the typical 3–4% beat that institutional desks have come to discount as “noise.” This is signal.
Now, contextualize that within the 2026 macro environment: we are operating in a landscape where the Federal Reserve has held the terminal rate stubbornly above 4.50%, enterprise IT budgets are being scrutinized with a precision the CFO suite hasn’t exercised since 2009, and software multiples have undergone a brutal normalization cycle since the peak liquidity era of 2021. In that backdrop, a company sustaining 71.41% gross margins is not treading water — it is demonstrating operating leverage that is structurally embedded, not cyclically inflated.
The whisper numbers circulating in buyside channels heading into this print were clustering around $1.54–$1.56, making the actual $1.62 delivery a beat of approximately 600–800 basis points above the quiet consensus. That’s not a rounding error. That’s a management team with visibility into their own model.
Wall Street analysts have subsequently pegged a 26.84% rally target from current levels, with independent fair value models suggesting as much as 44% upside — a spread that historically narrows sharply once institutional accumulation begins in earnest.
Financial Performance
| Segment/Metric | Current Result | Consensus/YoY | Strategic Signal |
|---|---|---|---|
| EPS (Q2 2026 Actual) | $1.62 | Consensus: $1.49 (+$0.13 beat) | Whisper-clearing beat; buyside re-rating catalyst likely deferred by macro noise |
| Gross Margin % | 71.41% | Sector average ~65–68% for comparable software peers | Above-peer gross margin signals durable pricing power and low COGS expansion risk |
| Total Annual Revenue | $978M (TTM) | Next Q estimate: $248M; implies sequential growth pressure | Sub-$1B revenue at 71%+ gross margin is a rare operating leverage setup |
| P/E Ratio (TTM) | 18.6x | Software sector median: ~28–32x TTM P/E | Deep discount to sector; catalysts for multiple expansion include margin guidance raise or M&A |
| EPS (Next Quarter Estimate) | $1.50 | Below Q2 actual of $1.62 (-$0.12 QoQ) | Sequential guide-down typical of conservative management framing; watch for beat pattern continuation |
| Market Capitalization | $1.58B | Price/Sales ~1.6x on $978M annual revenue | Historically low P/S for a 71%-margin software business; asymmetric risk/reward for long-duration holders |
Key Earnings Insights
- The Gross Margin Story Is the Real Alpha: At 71.41%, Progress Software is not just profitable — it is compounding its cost advantage. For practitioners who track incremental margin on revenue additions, this suggests that every dollar of new ARR flowing through the model drops to operating income at a rate well above the sector mean. The question institutional desks should be asking isn’t whether the margin is real; it’s whether management is investing aggressively enough in top-line acceleration to justify the multiple expansion that the margin profile already earns. R&D efficiency, not just spend, will be the differentiating variable in H2 2026.
- The 18.6x P/E Is a Structural Anomaly, Not a Discount Signal: When a software company with 71-handle gross margins trades at 18.6x trailing earnings — roughly a 35–40% discount to the sector median — one of two things is true: the market knows something about forward revenue deceleration that the numbers haven’t yet confirmed, or the stock is genuinely mispriced. The FactSet forward curve showing a next-quarter EPS estimate of $1.50 (versus the $1.62 Q2 actual) is modest sequential compression, not a structural deterioration. The compression looks like conservative management guidance cadence — a pattern that has historically resolved in favor of the beat-and-raise playbook.
- The -1.89% Reaction Day Is a Tactical Entry Point for Institutional Accumulation: Post-earnings day drawdowns on beats of this magnitude are a well-documented behavioral phenomenon in mid-cap software. Retail holders who bought the run-up into the print rotate out; institutional desks use the liquidity event to build or add. With analyst consensus pointing to 26.84% upside and independent models flagging 44% fair value gap, the risk-adjusted case for accumulation in the $37–$39 range is compelling. The market cap of $1.58B keeps this name just accessible for small-cap mandates while remaining too small for large-cap index pressure — a sweet spot for active managers seeking differentiated exposure.
The Practitioner’s Perspective
After 28 years of watching institutional money move through earnings cycles, I’ll tell you what this setup looks like at a mechanical level: it looks like late-stage price discovery before a re-rating event.
The current price of $38.42 on a $1.58B market cap — against $978M in annual revenue and 71.41% gross margins — doesn’t pass the “sniff test” for fair value. In a normalized rate environment, this business would command a 4–5x revenue multiple without debate. At today’s compressed 1.6x, you’re essentially getting the margin structure for free and paying a modest premium for the earnings stream.
From an institutional flow perspective, the sector rotation dynamic in 2026 is nuanced. The macro backdrop — persistently elevated rates, geopolitical friction in the semiconductor supply chain, and enterprise IT budget scrutiny from a CFO class that is actively renegotiating SaaS contracts — has pushed capital away from high-multiple growth software and toward profitable, cash-generative software names with defensible moats. Progress Software sits precisely in that sweet spot.
The recent headline noise comparing PRGS to Cadence Design Systems (CDNS) is actually a useful signal. When analysts start putting a profitable, reasonably priced enterprise software name in the same “value comparison” conversation as a premium EDA-sector compounder, institutional framing is shifting. That’s not a coincidence — that’s a sector rotation narrative starting to crystallize.
My 28-year read: the -1.89% reaction on a clean $0.13 beat is the market giving you a second boarding call on a flight that has already pushed back from the gate. The question is whether you’re still in the terminal.
Frequently Asked Questions
What does PRGS do?
Progress Software Corporation (PRGS) is a global enterprise software company that provides application development platforms, data connectivity solutions, and digital experience tools to businesses and independent software vendors (ISVs). The company’s core product portfolio includes the OpenEdge application development platform, the Telerik and Kendo UI developer tooling suite, the MarkLogic data management platform, and the Sitefinity digital experience platform. Progress Software primarily serves mid-market and enterprise customers across industries including financial services, healthcare, manufacturing, and government — essentially organizations that need robust, reliable software infrastructure to run mission-critical business processes. With $978M in trailing annual revenue and a customer base spanning more than 100 countries, Progress operates as a mature, profitable software business with a high-retention recurring revenue model.
The -1.89% move on earnings day is a textbook “sell the news” reaction, not a fundamental rejection of the results. Traders who positioned ahead of the print — anticipating the beat — rotated out on the liquidity event, creating short-term price pressure despite the $0.13 EPS upside surprise. This pattern is particularly common in mid-cap software names where the float is smaller and institutional repositioning creates outsized single-session volatility. The underlying financial performance — a $1.62 EPS print against a $1.49 consensus on 71.41% gross margins — remains structurally intact and, by most valuation frameworks, underpriced at current levels.
Why did PRGS stock decline -1.89% on an earnings beat?
Is PRGS stock undervalued in 2026?
Based on current metrics, the valuation case for PRGS appears compelling relative to software sector benchmarks. The stock trades at 18.6x trailing earnings and approximately 1.6x annual revenue — versus a software sector median of 28–32x P/E and 4–6x price-to-sales — while maintaining gross margins of 71.41%. Wall Street analyst consensus points to approximately 26.84% upside from recent price levels, and independent fair value models have flagged as much as 44% upside to intrinsic value estimates. The risk to this thesis is front-loaded in sequential EPS deceleration (next quarter estimate of $1.50 versus Q2’s $1.62) and the persistently elevated rate environment compressing software multiples broadly in 2026.
What is the next earnings catalyst for PRGS and what should investors watch?
The next key catalyst is Q3 2026 earnings, where the consensus EPS estimate sits at $1.50 and revenue estimates are targeting approximately $248M. Investors should monitor three specific variables: (1) whether management sustains or expands gross margins above the 71% threshold — any erosion here would reprice the operating leverage thesis; (2) the trajectory of recurring revenue and net revenue retention rates, which are the most reliable leading indicators of ARR durability in the current enterprise IT spending environment; and (3) any updated full-year 2026 guidance language, particularly around operating margin expansion, which would serve as the most direct signal that management sees operating leverage accelerating — the trigger most likely to catalyze institutional re-rating toward fair value.
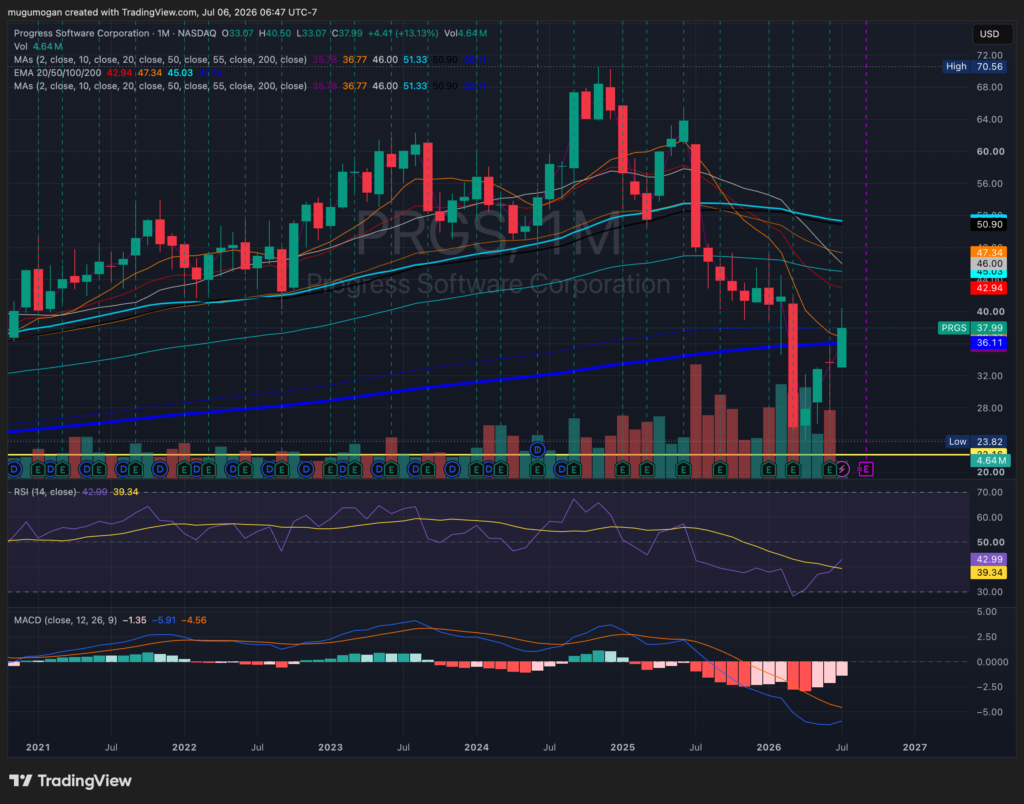
PRGS is attempting a rebound after finding support near the rising 200-month moving average, but it still trades below most shorter-term moving averages, so the primary trend remains cautious. RSI has recovered above 40 and the MACD histogram is improving, indicating bearish momentum is fading and a potential recovery is developing. A sustained move above the 20- and 50-month moving averages would strengthen the bullish case, while losing the 200-month moving average would invalidate the rebound.