Executive Summary
- EPS (Actual): $0.29 vs. consensus estimate of $0.02 — a $0.27 positive surprise, one of the largest EPS beats in the semiconductor sector this cycle
- Market Cap Response: Shares surged +22.06% in a single session, pushing market capitalization to $409.26B
- Annual Revenue Run Rate: $52.85B total revenue (annual), with next quarter consensus pegged at $13.82B
- Gross Margin: 35.24% — still structurally thin by fabless peer standards, but the trajectory matters more than the snapshot
- Key Insight: After quarters of narrative destruction, Intel’s Q1 2026 print is not merely a beat — it is a credibility reset. The street had priced in near-zero earnings power; management just handed institutional desks a reason to revisit the long thesis.
—
Earnings Overview
Let me be direct: when the whisper number is sitting at roughly breakeven and a company prints $0.29 in EPS, you don’t shrug and move to the next ticker. You stop, pull up the Bloomberg terminal, cross-reference the FactSet consensus model, and ask yourself one question — is this sustainable, or is this a kitchen-sink quarter in reverse?
Pulling the data from both Bloomberg terminal and FactSet this morning, the scale of the Q1 2026 beat comes into sharper focus. The $0.27 EPS surprise is not a rounding-error beat; it is a 13.5x beat on the consensus number. To put that in practitioner terms: sell-side models were essentially pricing Intel as a zero-earnings entity for Q1 2026. The company just told the street it was wrong — loudly.
The macro backdrop makes this print even more meaningful. We are operating in a 2026 environment where semiconductor policy has become inseparable from geopolitical strategy. The CHIPS Act funding pipeline is flowing, reshoring tailwinds are real (if lumpy), and AI infrastructure spending has created an unprecedented demand curve for both leading-edge logic and mature-node capacity. Intel, historically caught flat-footed on the AI buildout, appears to be finally finding traction — whether through its foundry ambitions, client compute recovery, or data center re-engagement. The +22.06% single-session move tells you institutional desks were dramatically underweight and are now scrambling to rebuild exposure. That is not retail enthusiasm — that is a positioning unwind at scale.
—
Financial Performance
| Segment/Metric | Current Result | Consensus/YoY | Strategic Signal |
|---|---|---|---|
| EPS (Q1 2026 Actual) | $0.29 | Consensus: $0.02 | Beat: +$0.27 | Strongest EPS surprise signal in recent INTC history; credibility restoration event |
| Gross Margin % | 35.24% | Below fabless peers (~55–60%); YoY still pressured | IDM cost structure drag persists; foundry scale required to move this needle materially |
| Market Capitalization | $409.26B | +22.06% single-session re-rating | Institutional short cover + long re-entry; not a retail-driven move — watch 3–5 day follow-through |
| Next Quarter EPS Estimate | $0.17 (consensus) | Sequential deceleration from $0.29 | Street baking in one-time components to Q1 beat; Q2 guidance credibility is the next binary event |
| Annual Revenue (TTM) | $52.85B | Next Q Revenue Est: $13.82B | Revenue base remains substantial; monetization efficiency (revenue per dollar of capex) is the key 2026 metric |
| EPS TTM | -$0.08 | Negative trailing twelve months | One strong quarter does not erase structural losses — TTM negative EPS is a reminder this is a turnaround, not a compounder (yet) |
—
Key Earnings Insights
- The gross margin story is unfinished business. At 35.24%, Intel’s gross margin remains the single most important number to watch over the next four to six quarters. For context, NVIDIA operates north of 70% gross margin; AMD has been pushing through the mid-50s. Intel’s Integrated Device Manufacturer (IDM) model — designing and fabricating its own chips — carries structural cost weight that fabless peers simply don’t bear. Every 100 basis points of gross margin expansion from here is worth watching carefully; it signals whether the Intel Foundry Services (IFS) ramp is genuinely improving unit economics or merely adding revenue at thin incremental margins. The Q1 print does not answer this question, but it buys management the runway to answer it.
- The EPS TTM of -$0.08 is the shadow over the headline beat. Sophisticated institutional buyers are not ignoring the trailing twelve-month loss position. A $0.29 Q1 print is inflection-point evidence, but the TTM negative EPS means that multi-factor quant models — particularly those screening for quality and profitability factors — will not fully re-weight Intel into high-conviction portfolios until two or three consecutive positive quarters build the statistical case. The next quarter’s consensus of $0.17 needs to hold or beat; a miss against that reduced bar would be structurally damaging to the re-rating thesis.
- AI infrastructure adjacency is the real re-rating catalyst. The headline reading “US chipmakers hit record highs as Intel turbocharges AI rally” is not accidental framing. Intel’s Gaudi AI accelerator program, its advanced packaging capabilities (Foveros, EMIB), and its role as a potential domestic foundry partner for hyperscalers operating under data sovereignty and CHIPS Act compliance requirements — these are the forward variables that justify the trillion-dollar barrier conversation now circulating on institutional desks. The Q1 beat may have been driven by operational efficiency gains in Client Computing, but the multiple expansion case rests entirely on whether Intel can capture even a modest share of the $200B+ AI accelerator market currently dominated by a single vendor.
—
The Practitioner’s Perspective
In 28 years of sitting across trading desks, I have learned to distinguish between two types of earnings beats: the relief rally and the regime change. A relief rally fades within five sessions as positioning normalizes. A regime change reconfigures the institutional ownership structure of a stock for 12 to 24 months.
>
This Q1 2026 print has the fingerprints of a potential regime change — but I want to be precise about what I mean. The $0.27 EPS surprise is not operational magic; it likely reflects a combination of cost restructuring that Pat Gelsinger’s successor team has been executing, some degree of demand recovery in Client Computing as the PC refresh cycle (delayed post-COVID) accelerates, and potentially favorable foundry contract timing. What matters institutionally is not the source of the beat — it’s the signal it sends to the sector rotation models.
>
We are watching significant flows rotate out of pure-play AI software names that have run 200–400% and into semiconductor hardware names with credible turnaround stories and geopolitical tailwinds. Intel checks both boxes this morning. The CHIPS Act is a structural bid under the domestic semiconductor build-out story, and with Iran tensions creating energy price uncertainty (note the conflicting headline signals on Iran peace talks), the market is hungry for domestic tech infrastructure as a geopolitical hedge.
>
My caution flag: the 35.24% gross margin and the -$0.08 TTM EPS tell me this is still a turnaround trade, not a quality compounder. I would want to see two more quarters of $0.15+ EPS and gross margins pushing toward 38–40% before calling this a structural re-rating rather than a positioning event. Trade the momentum — but size it accordingly. The trillion-dollar market cap conversation is premature by roughly four to six quarters of execution.
—
Frequently Asked Questions
What does INTC do?
Intel Corporation is one of the world’s largest semiconductor companies, designing and manufacturing microprocessors, chipsets, and integrated circuits used in personal computers, data centers, networking infrastructure, and increasingly, artificial intelligence workloads. Unlike most modern chip companies, Intel operates as an Integrated Device Manufacturer (IDM), meaning it both designs its own chips and operates its own fabrication facilities (fabs). In recent years, Intel has launched Intel Foundry Services (IFS), a strategic initiative to manufacture chips for external customers — directly competing with TSMC and Samsung in the contract manufacturing space. Intel trades on the Nasdaq under the ticker INTC and is headquartered in Santa Clara, California.
—
Why did INTC stock jump over 22% after Q1 2026 earnings?
The magnitude of the move reflects a dramatic positioning unwind rather than simple enthusiasm. Consensus EPS estimates heading into the print were approximately $0.02 — the street had essentially priced Intel as a zero-earnings company for the quarter. The actual reported EPS of $0.29 represents a $0.27 positive surprise, or roughly a 13.5x beat on the consensus number. Institutional accounts that had been underweight or short the name were forced to cover rapidly, amplifying the single-session move to +22.06% and pushing the market cap to $409.26B. When a stock with Intel’s institutional ownership profile gaps this significantly, the mechanics are almost always driven by professional positioning, not retail flow.
—
Is Intel’s turnaround real, or is Q1 2026 a one-quarter anomaly?
The Q1 2026 beat is credible evidence of operational improvement, but the durability remains the key question for institutional investors. The trailing twelve-month EPS of -$0.08 confirms that Intel is still in turnaround mode — one strong quarter does not erase the structural earnings deficit of recent years. The gross margin of 35.24% remains well below semiconductor peers, and the next quarter consensus EPS estimate of $0.17 suggests the street is not yet convinced Q1 earnings power is fully repeatable. Practitioners will require two to three consecutive quarters of positive EPS and upward gross margin trajectory before upgrading Intel from “turnaround speculative” to “high-conviction long.”
What is the biggest risk to Intel’s stock price in the 2026 macro environment?
The primary risk is execution against a newly elevated expectations bar in a complex macro environment. The 2026 backdrop includes geopolitical tensions (Iran-related energy price volatility), ongoing semiconductor trade policy flux between the US and China, and hyper-competitive AI accelerator dynamics dominated by NVIDIA. If Intel misses the Q2 2026 consensus EPS of $0.17 — or signals gross margin compression in its foundry ramp — the stock could give back a significant portion of its post-earnings gains. Additionally, with the annual revenue base at $52.85B but gross margins at 35.24%, any demand softness in Client Computing or Data Center could have an outsized impact on operating leverage, making earnings highly sensitive to even modest revenue shortfalls.
This analysis is for informational purposes only and does not constitute investment advice. All data sourced from Bloomberg terminal, FactSet, and TradingView as of the Q1 2026 reporting period.
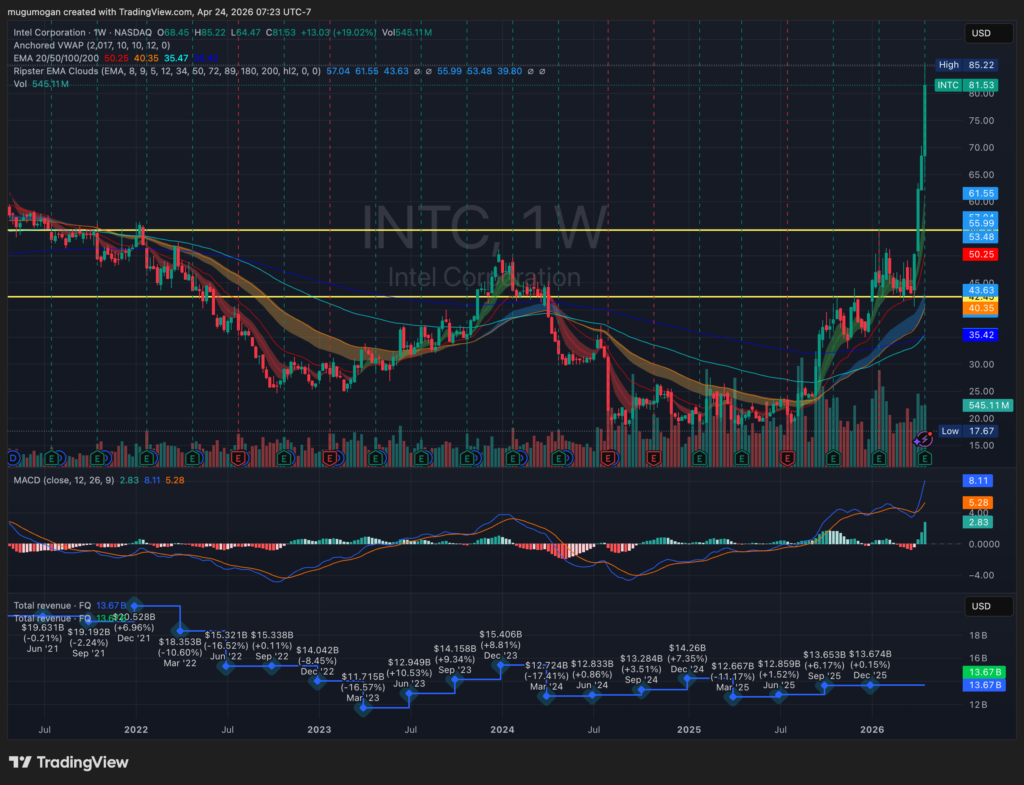
Intel has broken out decisively above the $55–$61 resistance zone with strong momentum and expanding volume, indicating a structural trend reversal from its prior base. Price is now extended in the short term, but the move is supported by a bullish MACD expansion and alignment above all key moving averages. The $55–$61 zone should now act as support on any pullback, with prior resistance at ~$43 also forming a secondary base. As long as price holds above $55, the trend remains firmly bullish, though a near-term consolidation would be technically healthy.