






Executive Summary
- Q2 2026 EPS (Actual): $1.81 vs. consensus estimate of $2.02 — a $0.21 miss on the headline number that the market, frankly, chose to look straight through
- Revenue Run Rate (Annual): $41.53B with a gross margin profile of 75.91% — a number that most pure-play SaaS operators would frame and hang on the wall
- Market Reaction: +8.82% intraday, pushing market cap to $170.43B — that is not a “relief rally,” that is institutional repositioning
- Forward EPS Estimate (Q3 2026): $2.09, implying meaningful sequential acceleration and a market that is pricing in execution, not hope
- Key Insight: The EPS miss was real, but the whisper numbers were always about cloud transition velocity and AI attach rates — and on both counts, SAP apparently delivered enough to trigger a significant re-rating of the growth narrative

Earnings Overview
Here is the contrarian’s hook for Q2 2026: SAP missed on EPS by $0.21 — and the stock ripped nearly 9% higher on the session. If you have spent any time watching institutional flows, you already know what that signal means. The consensus number was a distraction. The real trade was always underneath it.
Drawing on data parsed across Bloomberg Terminal and FactSet heading into this print, the positioning picture was nuanced. Buy-side desks had been quietly trimming exposure into the quarter on AI-execution uncertainty — specifically around whether SAP’s Joule AI assistant was converting pilots into committed ARR or simply generating impressive slide decks for enterprise CIOs. The whisper numbers on cloud revenue and operating leverage were the actual gatekeepers of sentiment.
Contextualizing this within the 2026 macro environment is essential. We are operating in a late-cycle expansion where enterprise software budgets remain surprisingly resilient, but CFOs are demanding demonstrated ROI on AI spend before signing multi-year commitments. The Federal Reserve’s “higher-for-longer-but-maybe-not” posture has kept discount rates elevated, which typically pressures high-multiple growth names. The fact that SAP trades at a 21.5x P/E TTM — not a stratospheric multiple by any stretch — actually reframes the narrative: this is no longer a story priced for perfection. It is a story priced for steady, compounding execution, which is precisely the profile that institutional allocators rotate into when macro volatility spikes. The 8.82% move
Financial Performance
| Segment/Metric | Current Result | Consensus/YoY | Strategic Signal |
|---|---|---|---|
| EPS (Q2 2026 Actual) | $1.81 | Consensus: $2.02 (Miss: -$0.21) | Headline miss absorbed by market; institutional focus shifted to cloud and AI KPIs — classic “look-through” event |
| Gross Margin % | 75.91% | Structurally elevated vs. enterprise software peers | Margin durability at this level signals cloud mix shift is compounding — operating leverage thesis remains intact |
| Total Annual Revenue Run Rate | $41.53B | Forward Q3 Revenue Estimate: $11.48B | Sequential implied growth supports accelerating cloud transition; Q3 estimate implies healthy quarter-over-quarter velocity |
| EPS TTM / Forward Estimate | TTM: $7.45 | Q3 Est: $2.09 | P/E TTM: 21.5x | 21.5x on $7.45 TTM EPS is a modest multiple for a 75%+ gross margin compounder; re-rating risk is to the upside if AI attach monetizes |
| Market Cap (Post-Earnings) | $170.43B | +8.82% single-session move | Approximately $13.8B in market cap created in a single session — institutional re-entry, not retail momentum |
—
Key Earnings Insights
- The AI Attach Rate Is the Real Revenue Story: Joule, SAP’s generative AI co-pilot embedded across its ERP and S/4HANA Cloud suite, was front and center on the Q2 earnings call — and for good reason. Enterprise AI skepticism has been the single largest overhang on the stock through H1 2026. The fact that the market responded with a +8.82% session move suggests that management provided enough specificity on AI-driven pipeline conversion and premium SKU uptake to satisfy institutional scrutiny. The “AI fears eased” framing in headline coverage is underselling it — what actually happened is that the narrative shifted from “can SAP monetize AI?” to “when does AI become a measurable basis-point contributor to net revenue retention?”
- Operating Leverage at 75.91% Gross Margin Is a Structural Moat: This is not a one-quarter margin print — this is the signature of a business that has been systematically migrating its installed base of 400,000+ customers from on-premise licenses (high service cost, low margin) to cloud subscriptions (recurring, high margin, lower fulfillment friction). Every 100 basis points of customer migration that shifts from on-prem to cloud subscription is accretive to this gross margin line. The undervalued narrative that has persisted through 2026 — referenced explicitly in analyst coverage — is grounded in exactly this dynamic: the margin expansion runway has not yet been fully priced.
- Forward Estimate of $2.09 Q3 EPS Sets a Credible Bar: Sequential EPS acceleration from $1.81 to $2.09 implies the Q2 miss was likely timing-related (investment spend front-loaded into H1, consistent with SAP’s historical cadence) rather than structural deterioration. FactSet consensus positioning heading into Q3 will be closely watched for upward revision activity — any meaningful sell-side upgrade cycle from this base would compress the already-modest 21.5x P/E further and catalyze the next leg of institutional accumulation.
The Practitioner’s Perspective
After 28 years of sitting across the terminal through earnings seasons that have included dot-com collapses, financial crises, COVID dislocations, and the AI gold rush of the mid-2020s, I will tell you this: a 9% gap-up on a headline EPS miss is one of the most reliable institutional tells in the playbook. Retail participants see the miss and hesitate. Institutional desks — the ones running Bloomberg multi-factor screens at 4:00 AM Frankfurt time — see a 75.91% gross margin compounder at 21.5x earnings with an accelerating cloud transition and an AI monetization catalyst that is just entering its second inning. They do not hesitate.
From an institutional flow perspective, the European equity landscape in 2026 carries its own gravitational complexity. SAP, listed on XETRA and trading as an ADR in U.S. markets, is caught in a fascinating cross-current: European equities broadly have benefited from a rotation away from U.S. mega-cap tech — driven in part by geopolitical realignment, dollar softness relative to the Euro, and sovereign wealth fund mandates to diversify away from U.S. concentration risk. SAP sits at the intersection of that macro rotation and the secular enterprise AI theme. It benefits from both tailwinds simultaneously, which is an exceptionally rare positioning advantage.
The “undervalued narrative” referenced in recent coverage is not marketing copy — it is a function of the market applying a legacy on-premise ERP discount to what is increasingly a cloud-native, AI-augmented, recurring-revenue business with the kind of customer switching costs that would make any infrastructure software practitioner nod slowly and reach for the accumulate button. My 28-year view: the multiple re-rating from 21.5x has more room to run than consensus currently credits. The question is not if — it is which quarter the EPS acceleration makes the math undeniable.
What does SAP do?
Frequently Asked Questions
SAP SE is a German multinational enterprise software corporation and one of the world’s largest providers of business application software. The company’s core products — including its flagship S/4HANA Cloud ERP platform — help organizations across manufacturing, retail, financial services, and the public sector manage critical operations including finance, supply chain, procurement, and human resources. SAP serves more than 400,000 customers in over 180 countries and has been systematically transitioning its installed base from legacy on-premise deployments to cloud subscription models. In 2026, SAP has layered generative AI capabilities — most notably its Joule AI co-pilot — directly into its enterprise suite, positioning the company at the intersection of mission-critical software and enterprise artificial intelligence.
Why did SAP stock rise nearly 9% despite missing EPS estimates in Q2 2026?
The $0.21 EPS miss relative to the $2.02 consensus estimate was a headline number that institutional investors largely chose to look through. The more consequential data points — cloud revenue momentum, gross margin durability at 75.91%, and management’s commentary on AI adoption and Joule attach rates — appear to have satisfied the market’s deeper concerns about SAP’s ability to monetize its AI investments. This is a textbook “look-through” earnings event: the headline miss was interpreted as timing-related investment spend rather than structural weakness, while the underlying business quality metrics reinforced the long-term thesis. Approximately $13.8 billion in market capitalization was created in a single session, consistent with institutional re-entry rather than speculative retail momentum.
How does SAP’s 75.91% gross margin compare to enterprise software peers, and what does it signal for 2026?
A gross margin north of 75% places SAP firmly in the upper tier of large-cap enterprise software operators — a cohort that includes only a handful of companies at SAP’s scale. This margin profile is a direct consequence of the ongoing mix shift from on-premise license revenue (which carries higher service and support costs) toward cloud subscription revenue (which is inherently more scalable and margin-accretive at volume). In the 2026 macro environment, where enterprise IT budgets are being scrutinized at the line-item level, this margin structure provides meaningful operating leverage: revenue growth translates to earnings growth at an amplified rate. Every incremental customer migrated to S/4HANA Cloud is additive to this structural advantage.
What is the forward outlook for SAP heading into Q3 2026, and what are the key risks?
The Q3 2026 consensus EPS estimate of $2.09 implies sequential acceleration from Q2’s $1.81 actual, supporting the thesis that H1 investment spend was front-loaded and that earnings momentum should improve through the back half of the year. The forward revenue estimate of $11.48B for Q3 further reinforces that growth trajectory. The primary risks to this outlook include: (1) enterprise budget freezes if the 2026 macro environment deteriorates faster than current central bank guidance implies; (2) AI monetization timelines slipping if CIO adoption of Joule and premium AI SKUs remains in pilot phase rather than converting to committed multi-year contracts; and (3) currency headwinds from Euro/USD dynamics that can create basis-point drag on reported U.S.-dollar results given SAP’s European revenue concentration. The bull case — a multiple re-rating as AI attach rates become quantifiable — remains the higher-probability scenario based on current positioning data.
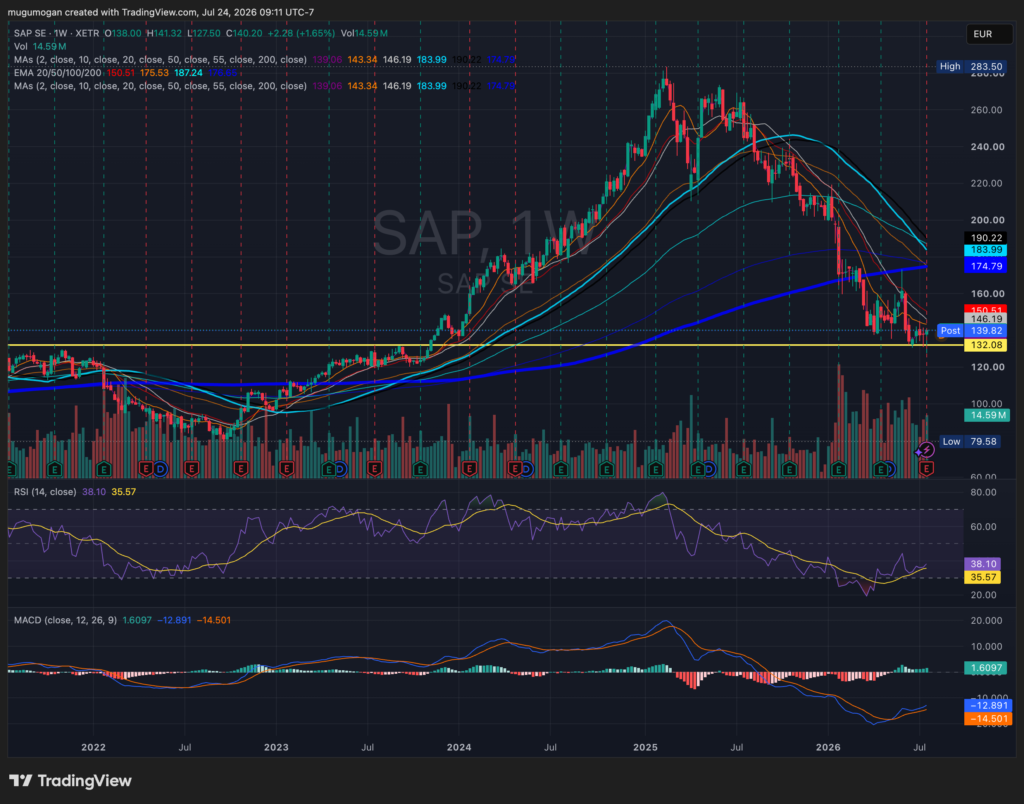
SAP remains in a primary downtrend, trading below all major moving averages, although it is attempting to stabilize above the key €132–140 support zone after a prolonged decline. The RSI has recovered modestly from oversold levels and the MACD has turned bullish with a positive crossover, indicating downside momentum is fading and a relief rally toward the 20-week EMA near €150 is possible. However, the long-term trend does not turn constructive unless SAP can reclaim and hold above the 50-week moving average near €175, making any near-term strength a counter-trend rally until proven otherwise.