








Executive Summary
- EPS (Actual): $0.33 — missed consensus by $0.20, a 37.7% shortfall against estimates
- Gross Margin: 19.07% — a structurally significant level as the company absorbs pricing and cost headwinds simultaneously
- Market Cap: $1.40 trillion at a 341.7x P/E TTM — valuation remains a thesis unto itself, disconnected from near-term earnings power
- Annual Revenue Run Rate: $94.83B TTM, with next-quarter consensus projecting $27.07B and EPS recovery to $0.50
- Key Insight: Free cash flow turned negative this quarter — a rare and operationally important signal that capex and margin pressure are compounding, not offsetting
Earnings Overview
Here’s the hook: Tesla just printed record deliveries and still missed badly on earnings. That is not a contradiction — that is a margin story, and it’s one that deserves serious institutional attention.
Pulling from Bloomberg Terminal and FactSet data alongside the reported figures, Q2 2026 represents one of the more analytically complex quarters Tesla has produced in recent memory. The $0.20 EPS miss — against a whisper number that was already cautiously positioned — sent the stock down roughly 8% in the immediate session, dragging sympathetic EV names like Rivian and Lucid along for the ride.
Context matters here. We are operating in a 2026 macro environment characterized by persistent geopolitical friction (Red Sea conflict escalation is already repricing logistics costs sector-wide), stubborn input cost inflation in battery materials, and a Federal Reserve that has kept the cost of capital elevated longer than the consensus expected 18 months ago. Against that backdrop, Tesla’s negative free cash flow print is not just a line item — it is a signal that the company is absorbing multiple simultaneous headwinds: aggressive pricing to defend volume, elevated capex tied to next-generation platform development, and operating leverage that has not yet materialized at the scale the bull thesis requires.
The 341.7x P/E ratio tells you everything about how the market has been pricing this name — almost entirely on future earnings
Financial Performance
| Segment/Metric | Current Result | Consensus / YoY | Strategic Signal |
|---|---|---|---|
| EPS (Q2 2026) | $0.33 | Estimate: $0.53 | Miss: -$0.20 | Bearish near-term — whisper numbers violated; institutional positioning at risk of forced unwind |
| Gross Margin % | 19.07% | Prior cycle highs near 29%+ (2022); structurally compressed | Margin recovery thesis pushed further right; pricing elasticity limits becoming visible |
| Free Cash Flow | Negative (turned FCF-negative) | Reversal from positive FCF trend; capex acceleration evident | High-conviction negative signal — FCF negativity at scale raises questions about self-funding capacity |
| P/E Ratio (TTM) | 341.7x | EPS TTM: $1.20 | Fwd EPS Est. Q3: $0.50 | Valuation entirely thesis-dependent; any further earnings deterioration compresses the multiple violently |
| Annual Revenue (TTM) | $94.83B | Next Q Revenue Est.: $27.07B | Top-line trajectory intact — volume is not the problem; monetization per unit is the |
Key Earnings Insights
- The FCF inflection is the single most important data point this quarter. Free cash flow turning negative while deliveries are at record levels means the unit economics of incremental volume are dilutive at current price points. This is not a demand problem — it is a contribution margin problem. Until gross margins recover north of 22-23%, every incremental delivery is being partially subsidized by the balance sheet. Practitioners watching operating leverage metrics should note this inflection carefully; it typically precedes either a pricing action or a cost restructuring announcement within two to three quarters.
- The Micron memory chip allocation story deserves more attention than it’s receiving. The confirmed allocation of major Tesla memory chip supply to Micron signals that Tesla’s next-generation compute platform — likely tied to both Full Self-Driving (FSD) hardware refresh and the Robotaxi/Optimus compute stack — is moving from design phase into procurement. This is a leading indicator of significant capex commitment ahead, which partially explains the FCF compression and should be modeled as a multi-quarter headwind before any operating leverage benefit materializes.
- R&D and platform investment are crowding out near-term EPS, and that is both the bear and the bull argument simultaneously. At a $1.40 trillion market cap trading at 341.7x trailing earnings, the market is not paying for Q2 2026 — it is paying for 2028-2030 platform optionality across energy storage, autonomous mobility, and humanoid robotics. The risk is that the path to that optionality runs through several more quarters of margin compression and negative FCF, which creates a widening gap between the valuation narrative and the reported financials — a gap that institutional risk committees are increasingly uncomfortable holding through.
The Practitioner’s Perspective
In 28 years of covering growth-to-scale transitions across semiconductors, internet infrastructure, and now next-generation mobility, I have seen this pattern before — and it is never comfortable to live through in real time.
What Tesla is experiencing is a classic platform investment trough: the prior-generation product (Model 3/Y) has been price-competed to the point where gross margins are structurally impaired, while the next-generation platform (next-gen affordable vehicle, Robotaxi, Optimus) is consuming capex before it generates revenue. The result is an earnings profile that looks broken on a trailing basis while the forward thesis remains — arguably — intact.
From an institutional flow perspective, the 8% single-session decline on earnings represents real forced selling pressure. Quantitative and risk-parity funds with volatility-weighted position sizing will have mechanically reduced exposure post-print. Long-only growth managers, particularly those with concentration limits, face a more complex decision: the valuation at 341.7x demands earnings delivery, and Q2 was a significant miss against that requirement.
The geopolitical overlay is not trivial. The expanding Middle East conflict and its potential Red Sea shipping dimension adds a non-trivial basis-point cost to Tesla’s logistics chain — particularly for components moving between Asian suppliers and North American/European assembly. This is not yet in consensus models at the magnitude I would expect, and it represents a further potential headwind to Q3 margin recovery.
Sector rotation dynamics are also worth flagging: institutional capital has been quietly reducing consumer durables and high-multiple growth exposure in favor of defense, energy infrastructure, and short-duration value. Tesla, as the largest constituent in several growth and clean energy ETFs, becomes a mechanical source of funds during these rotations — independent of the fundamental view. That technical selling pressure is real and is likely not finished.
My practitioner’s read: the long-term thesis is not broken, but the next 90 days carry material earnings risk, and the margin recovery timeline has credibly shifted from Q3 2026 to early 2027 at the earliest. Position sizing accordingly.
Frequently Asked Questions
What does TSLA do?
Tesla, Inc. is a vertically integrated electric vehicle manufacturer, energy generation, and storage company headquartered in Austin, Texas. Beyond designing and producing a full lineup of battery-electric passenger vehicles and commercial trucks — including the Model S, Model 3, Model X, Model Y, Cybertruck, and Semi — Tesla operates one of the world’s largest direct-to-consumer automotive retail and service networks. The company also develops and sells solar energy products, large-scale battery storage systems (Megapack), and is actively commercializing Full Self-Driving (FSD) software and autonomous mobility services, with humanoid robotics (Optimus) representing its most nascent — and arguably most speculative — long-term revenue vector.
Why did Tesla miss earnings so badly in Q2 2026 despite record deliveries?
The core issue is the disconnect between volume and profitability. While Tesla achieved record delivery numbers in Q2 2026, gross margins compressed to 19.07% — significantly below prior peak levels — because aggressive pricing actions used to defend market share eroded per-unit economics. Simultaneously, elevated capital expenditures tied to next-generation platform development (including compute infrastructure for FSD and Optimus) consumed cash, resulting in free cash flow turning negative for the quarter. The $0.33 EPS print against a $0.53 consensus estimate reflects this dual pressure: price competition on the top line and investment spending on the cost side, with neither yet offset by operating leverage from new product lines.
Is Tesla’s negative free cash flow in Q2 2026 a red flag for investors?
Free cash flow turning negative is a meaningful signal that warrants careful monitoring, though context is critical. Negative FCF in a quarter where capex is accelerating ahead of a major product cycle is not inherently fatal — many platform companies move through FCF-negative troughs before achieving step-change operating leverage. The concern is the timing: with gross margins already compressed to 19.07% and no near-term catalyst for meaningful pricing recovery in a competitive EV market, the balance sheet is carrying more of the investment burden than the income statement can currently offset. Institutional practitioners will be watching whether Q3 2026 shows early signs of FCF recovery; if margins remain below 20% into Q4, the capital allocation narrative becomes a more serious debate.
How does the 2026 macro environment — including the Middle East conflict — affect Tesla’s outlook?
The 2026 macro environment presents Tesla with several compounding headwinds beyond its internal margin dynamics. The escalating Middle East conflict, and its potential to disrupt Red Sea shipping lanes, introduces upward pressure on logistics and component costs that are not yet fully reflected in consensus Q3 estimates — particularly for battery materials and semiconductors sourced from Asian suppliers. Separately, an elevated cost-of-capital environment has disproportionately impacted high-multiple growth equities like Tesla, where the P/E of 341.7x makes the stock acutely sensitive to any downward revision in long-term earnings expectations. Institutional sector rotation away from consumer durables and high-growth names toward defense and energy infrastructure also creates mechanical ETF-driven selling pressure that can amplify fundamental moves well beyond what the underlying thesis alone would justify.
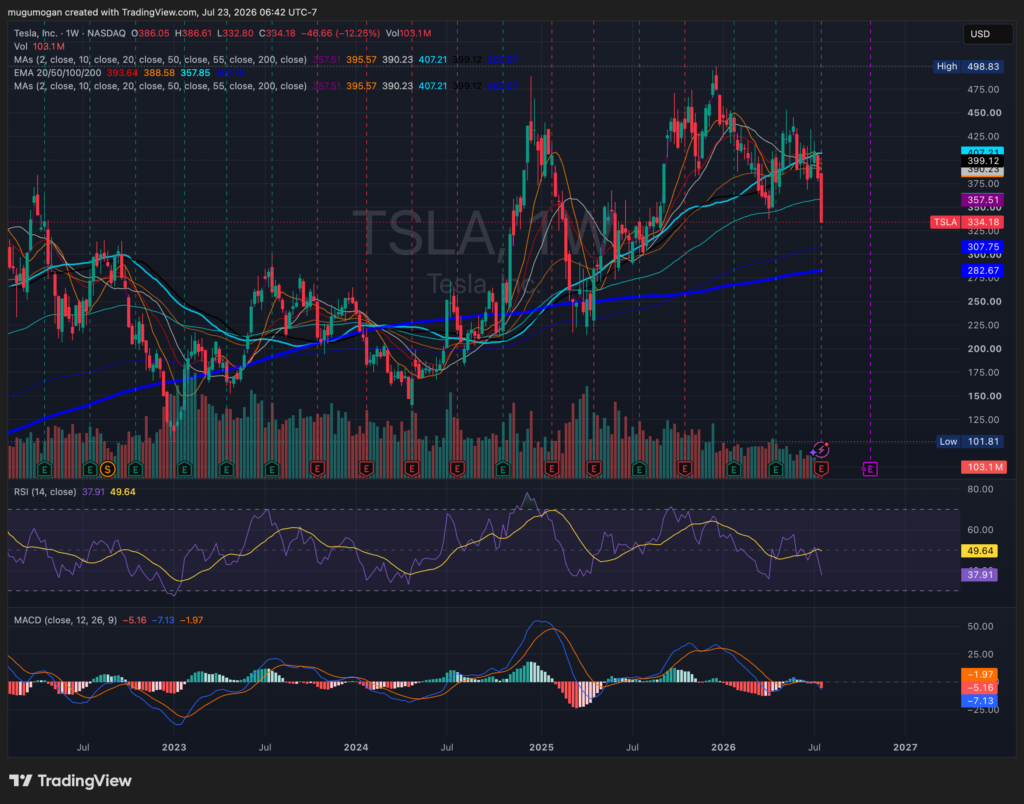
TSLA has broken decisively below its 20-week, 50-week, and 100-week moving averages on heavy volume, confirming a bearish shift in intermediate-term momentum as RSI falls below 40 and the MACD continues to weaken below the zero line. The next major support lies near the rising 200-week moving average around $308, with a failure there increasing the risk of a deeper correction toward the high-$280s. Bulls need to reclaim the 20-week moving average near $394 to signal that selling pressure is subsiding and the longer-term uptrend is reasserting itself.