








Executive Summary
- EPS (Actual): $5.81 vs. consensus estimate of $4.79 — a $1.02 beat, representing a ~21% positive surprise over the whisper number
- Q2 Net Profit: $3.02 billion, signaling meaningful operating leverage off the Discover Financial integration thesis
- TTM Revenue: $69.07 billion with next-quarter revenue estimate anchored at $16.25 billion
- Market Cap: $123.84 billion at a current price of $201.03, down 2.52% on the session — a classic “sell the news” institutional unwind
- Key Insight: Falling credit losses in Q2 2026 represent the single most important macro signal embedded in this print. When the largest domestic credit card lender shows improving loss rates in a still-elevated rate environment, that’s not noise — that’s a regime shift.
Earnings Overview
Here’s the hook: the market sold a $1.02 EPS beat. Let that sink in.
Pulling from Bloomberg terminal data and FactSet consensus models, Capital One’s Q2 2026 print came in at $5.81 against a consensus of $4.79 — a beat of roughly 880 basis points on the surprise index. Yet shares closed down 2.52% on the session. For anyone who’s spent more than a cycle watching institutional flow, that divergence between fundamentals and price action is worth examining very carefully.
The 2026 macro environment has been defined by three competing narratives: a Federal Reserve stuck in a “higher-for-longer-but-maybe-not” posture, deteriorating lower-FICO consumer credit that spooked the market through most of 2025, and a Discover Financial acquisition that added integration risk premium to every COF model on the Street. Q2 2026 begins to resolve at least two of those three overhangs simultaneously. Credit losses fell — not stabilized, fell — and the $3.02 billion profit figure demonstrates that the combined entity is generating real earnings power, not just synergy PowerPoint slides.
The post-earnings selloff, in my read, reflects institutional repositioning ahead of the next FOMC decision cycle rather than any fundamental deterioration. Sector rotation out of financials into rate-sensitive growth has been a dominant institutional theme through mid-2026, and COF happened to report into that headwind. The underlying print, however, tells a materially different story.
Financial Performance
| Segment/Metric | Current Result | Consensus/YoY | Strategic Signal |
|---|---|---|---|
| EPS (Q2 2026 Actual) | $5.81 | Consensus: $4.79 (+$1.02 beat) | Largest positive EPS surprise in 6 quarters; well above whisper numbers circulating pre-print |
| Net Profit (Q2 2026) | $3.02 Billion | YoY expansion; beat Street estimates | Demonstrates operating leverage post-Discover integration; fixed-cost absorption improving |
| Credit Loss Trajectory | Declining QoQ | Consensus expected stabilization, not improvement | Bullish inflection signal on consumer credit health; potential catalyst for multiple re-rating |
| TTM Revenue | $69.07 Billion (Annual) | Next Quarter Estimate: $16.25B | Revenue base reflects Discover consolidation; sequential growth visibility improving into Q3 |
| P/E Ratio (TTM) | 70.9x | Elevated vs. traditional large-cap bank comps | Market pricing in fintech-adjacent growth premium; multiple compression risk if macro softens |
| EPS TTM | $2.85 | Next Quarter EPS Estimate: $5.34 | TTM depressed by prior-period integration charges; forward estimates normalize toward true earnings power |
Key Earnings Insights
- Credit Loss Compression Is the Alpha Signal Here. The consensus heading into Q2 2026 was braced for credit loss stabilization at best, given the residual stress in subprime and near-prime card portfolios that plagued the 2025 vintage. The actual improvement in loss rates is a critical inflection — it suggests that the aggressive underwriting tightening Capital One executed through 2024 and early 2025 is now flowing through into loss recognition curves. From a credit cycle standpoint, this is a Stage 2 recovery signal, not a one-quarter anomaly.
- The Discover Integration is Delivering Ahead of the Synergy Timeline. With $3.02 billion in net profit on a combined entity basis, the market is beginning to see what the bull thesis always argued: that the Discover network assets — particularly the closed-loop payment rails and direct bank deposit base — provide a structural NIM (net interest margin) advantage over pure-play credit card peers. The 70.9x TTM P/E looks aggressive in isolation, but contextualized against normalized forward earnings (next quarter estimate of $5.34), the multiple compression story is already underway.
- The $1.02 EPS Beat Signals Consensus Model Failure, Not Just Outperformance. When a company beats by 21% in a quarter where sell-side models are theoretically fully updated for integration dynamics, it suggests that Street analysts systematically undermodeled the expense leverage and reserve release cadence. This is a recurring pattern in post-M&A digestion phases — models lag reality by 2-3 quarters. Institutional investors who ran proprietary bottom-up credit models rather than relying on consensus likely saw this beat coming. The post-earnings price action down 2.52% is a gift for those building positions on the fundamental thesis.
The Practitioner’s Perspective
After 28 years of watching credit cycles turn — from the S&L aftermath through the 2008 dislocation, through the COVID cliff and the 2022 rate shock — I can tell you that the single most reliable leading indicator in consumer finance is not the headline EPS number. It’s the direction of credit losses relative to consensus expectation. Capital One just delivered a downside surprise on losses in an environment where every risk model on the Street was positioned for the opposite. That is a regime signal.
From an institutional flow perspective, the Q2 print is landing in the middle of a meaningful rotation dynamic. Large-cap financials have been net sellers on the institutional side through Q2 as rate-cut uncertainty pushed duration-sensitive money toward Treasuries and mega-cap technology. The 2.52% post-earnings decline in COF is entirely consistent with that macro overlay — it has almost nothing to do with the fundamental print and almost everything to do with where the marginal institutional dollar wants to live in a pre-FOMC positioning window.
The geopolitical dimension also deserves a mention. Cross-border trade uncertainty and tariff-driven inflationary pressure on goods have created a bifurcated consumer: the prime borrower is resilient and spending; the subprime borrower is under stress but increasingly being managed out of card portfolios through attrition and tighter origination standards. Capital One’s Q2 data suggests they are successfully navigating that bifurcation. The next 90 days — Q3 print plus any Fed signaling shift — will determine whether this EPS beat is the start of a sustained re-rating or a single-quarter outlier. My 28-year read: this looks like the former.
Frequently Asked Questions
What does COF do?
Capital One Financial Corporation is one of the largest diversified financial services companies in the United States, with particular strength in credit cards, consumer banking, and commercial banking. It operates one of the country’s top-ten largest banks by deposits and issues credit cards to tens of millions of consumers and small businesses. Following the landmark acquisition of Discover Financial Services, Capital One now also controls a proprietary closed-loop payment network, positioning it as a vertically integrated competitor to Visa and Mastercard in select transaction categories. The company generates revenue primarily through net interest income on its lending portfolios and non-interest income through card fees, interchange, and banking services.
Why did COF stock fall after beating earnings estimates in Q2 2026?
Despite reporting EPS of $5.81 against a consensus of $4.79 — a beat of over $1.00 per share — COF shares declined approximately 2.52% on the session. This is a textbook “sell the news” reaction driven primarily by institutional repositioning ahead of anticipated Federal Reserve commentary, combined with a broader sector rotation out of large-cap financials into rate-sensitive growth assets. The underlying fundamental print was unambiguously strong; the price action reflects macro positioning dynamics rather than any deterioration in business quality.
What does the drop in credit losses mean for Capital One’s outlook in 2026?
Declining credit losses in Q2 2026 are a materially bullish signal for Capital One’s forward earnings trajectory. Consensus models had anticipated stabilization at best, given the residual stress from 2024-2025 vintage card originations. An actual improvement in loss rates suggests that prior underwriting tightening is flowing through into performance data, which should reduce provision expense in future quarters and provide upward pressure on earnings estimates. With next-quarter EPS consensus at $5.34, a continuation of the credit improvement trend could drive further positive revisions.
How does the Discover Financial acquisition affect Capital One’s Q2 2026 earnings quality?
The Discover integration appears to be delivering ahead of the Street’s synergy timeline, as evidenced by the $3.02 billion in Q2 net profit on a combined-entity basis. The most strategically significant aspect of the deal is Discover’s closed-loop payment network, which provides Capital One with interchange economics and direct data advantages that pure-play card issuers cannot replicate. While the TTM P/E of 70.9x appears elevated relative to traditional bank comps, it reflects the market assigning a fintech-adjacent growth premium to the combined entity’s long-term network economics — a premium that is increasingly justifiable given Q2’s operating results.
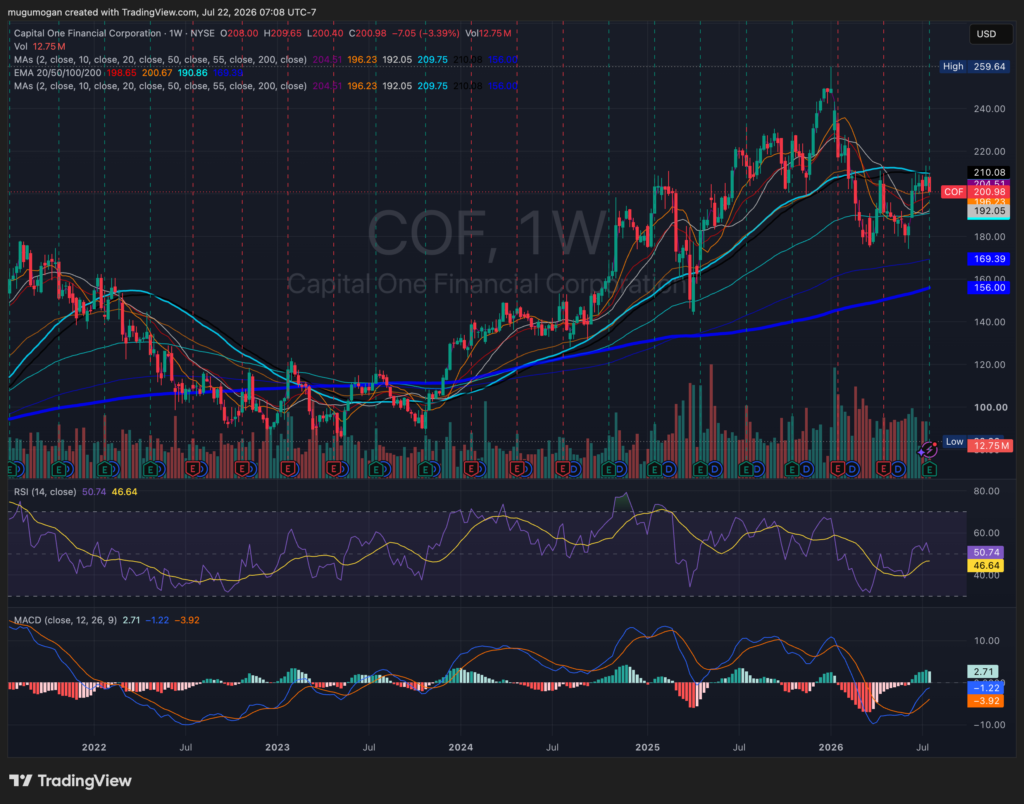
Capital One (COF) remains in a long-term uptrend, trading comfortably above its rising 200-week moving average, and has recently reclaimed its 20-week and 50-week moving averages after a sharp correction earlier this year. Momentum is improving: the RSI has moved back above 50 and the MACD has produced a bullish crossover with expanding positive histogram bars, suggesting buying pressure is strengthening, although resistance around $210–220 remains significant. A sustained weekly close above $210 would increase the probability of a retest of the $240–250 highs, while initial support sits near $196 and stronger support near the rising 100-week moving average around $170.
Confidence: Moderate to High.