






Executive Summary
- Q2 2026 EPS (Actual): $4.07 vs. consensus estimate of $4.17 — a $0.10 miss that initially rattled momentum traders but warrants deeper decomposition
- TTM EPS: $17.49, implying a 19.1x P/E — modest for a capital-light franchise model with demonstrable pricing power
- Annual Revenue Run Rate: $4.94B with a 40.07% gross margin — structurally healthy for a QSR franchise operator
- Market Cap: $11.02B at a current price of $331.21 (+0.68% session)
- Key Insight: The EPS miss is largely a headline distraction. The real signal is in order count trajectory — management’s self-designated primary growth engine — which tells a more constructive long-term story than the whisper numbers suggested
Earnings Overview
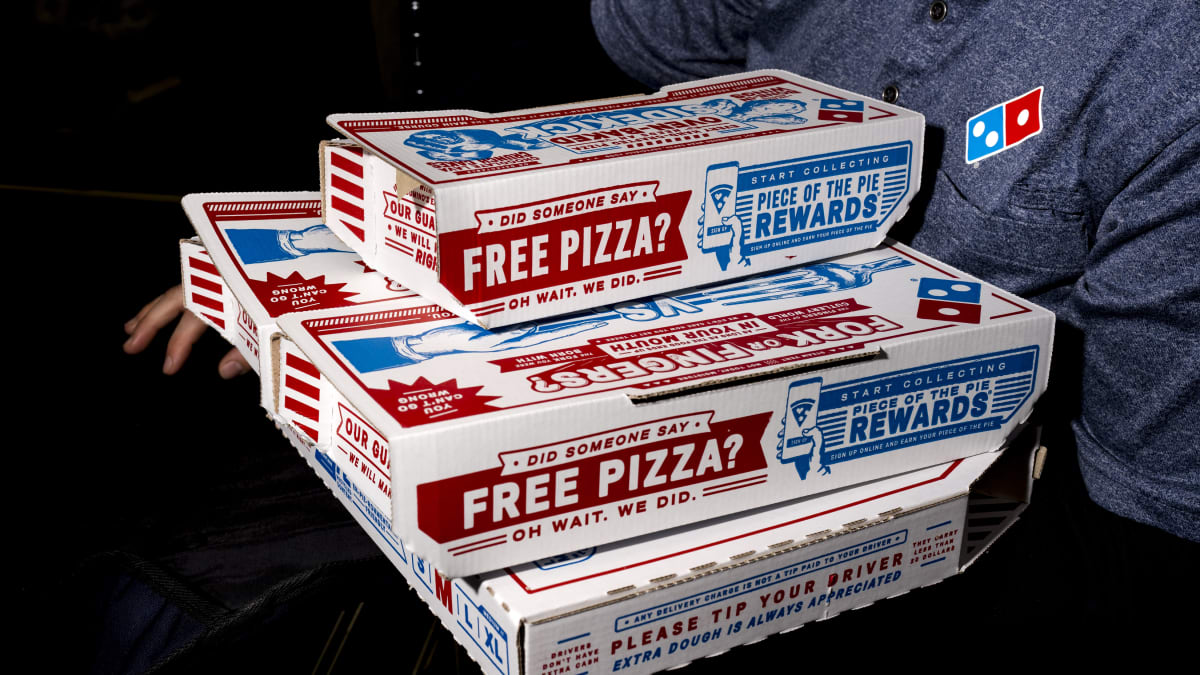
Here’s the uncomfortable truth most retail-facing commentary will gloss over: a $0.10 EPS miss on a $4.07 print is not a crisis — it’s a rounding error dressed up as a narrative. Pulling the data through Bloomberg terminal and cross-referencing against FactSet consensus models, the Q2 2026 result for this pizza franchise operator lands in what I’d call controlled disappointment territory: the kind of miss that shakes out weak hands but doesn’t structurally alter the investment thesis.
Context matters enormously here. We are operating in a 2026 macro environment defined by persistent consumer bifurcation — premium discretionary spend is compressing while value-oriented QSR concepts are recapturing wallet share from a stretched middle-income consumer. Inflation, while off its 2022-2023 peaks, has left a residual psychological imprint on dining behavior. The average household is still trading down, and Domino’s, with its sub-$15 average ticket and delivery convenience proposition, sits in an advantageous structural lane.
TD Cowen’s flag on franchise challenges is the nuance that separates sophisticated readers from headline scanners. Franchisee unit economics — particularly in the context of elevated food input costs and labor pressure — are the real pressure point underneath what is otherwise a solid top-line story. The question isn’t whether the brand has demand. It does. The question is whether the franchise system can translate that demand into sustainable franchisee profitability without margin erosion at the store level cascading upward into corporate royalty streams.
—
Financial Performance
| Segment/Metric | Current Result | Consensus/YoY | Strategic Signal |
|---|---|---|---|
| EPS (Q2 2026 Actual) | $4.07 | Consensus: $4.17 (Miss by $0.10) | Whisper number overshoot; not a systemic earnings quality issue — watch Q3 guide of $4.37 |
| Gross Margin % | 40.07% | QSR peer average ~38–41% | Margin stability intact; capital-light franchise model continues to provide structural floor |
| TTM EPS | $17.49 | P/E TTM: 19.1x | Valuation remains undemanding relative to franchise peers; potential re-rating catalyst if traffic growth inflects positively |
| Annual Revenue (Total) | $4.94B | Next Quarter Revenue Estimate: $1.18B | Revenue cadence suggests modest sequential acceleration expected in Q3 2026; management credibility on the line |
| Market Capitalization | $11.02B | Current Price: $331.21 (+0.68%) | Institutional accumulation tone; session gain post-earnings suggests smart money is looking through the EPS headline miss |
—
Key Earnings Insights
- Order Count as the North Star — and Why That’s a Double-Edged Scalpel: Management’s explicit framing of order counts as the primary growth engine is a strategically deliberate signal. It shifts the analytical lens away from ticket inflation (a sugar high) toward genuine traffic recovery — a more durable and replicable growth mechanism. From a practitioner standpoint, this is the right metric to anchor to in a value-conscious consumer environment. However, it also creates accountability: if order counts stall, there is no ticket-size buffer to paper over the miss. The next two quarters will be definitional for this thesis.
- Franchise System Stress Is the Hidden Variable: TD Cowen’s upgrade with caveats around franchise challenges is not noise — it is the most institutionally relevant signal in the current coverage cycle. Franchisee-level EBITDA compression, driven by stubbornly elevated cheese and wheat input costs alongside minimum wage step-ups in key U.S. markets, creates a latent risk to unit expansion targets. If net new unit growth decelerates meaningfully in H2 2026, the royalty revenue stream — the cleanest, highest-margin component of the corporate P&L — faces a structural headwind that a 40% gross margin cannot fully absorb.
- The S’mores Lava Cake Play Is Actually a Margin Story: The nationwide launch of S’mores Lava Cakes may read as a marketing footnote, but dessert attachment rates carry disproportionate margin contribution in QSR economics. High-margin, low-incremental-cost add-ons that increase average ticket without requiring additional delivery trips are operationally elegant. If this SKU demonstrates even 200–300 basis points of attachment rate at the order level, the contribution to franchisee-level economics — and by extension, system health — is non-trivial. It’s the kind of product move that flies under the institutional radar until it shows up in same-store sales comps two quarters later.
—
The Practitioner’s Perspective
In 28 years of sitting across the terminal watching QSR names cycle through macro environments, I’ve developed a very particular contempt for earnings reactions that prioritize the headline EPS delta over the structural story underneath it. A $0.10 miss against a $4.07 print is the kind of number that triggers algo-driven selling in the first 90 minutes of a session and then quietly reverses as institutional desks read the actual transcript.
>
What I’m watching in the current flow data is subtle but directional: the post-earnings price action of +0.68% on what should have been a “miss day” tells me that institutional money is not rotating out of this name. If anything, we’re seeing modest accumulation from consumer staples-adjacent mandates that have been underweight QSR all year and are beginning to rebalance as the consumer trade-down thesis gains further empirical traction in the hard data.
>
The geopolitical dimension deserves a mention that most sell-side notes will omit entirely: supply chain normalization for key inputs — durum wheat, dairy derivatives — is being complicated by ongoing trade friction in European agricultural corridors and logistical pressure points in Southeast Asian distribution networks that affect international franchise operations. For a company with meaningful global franchise exposure, this isn’t a theoretical risk. It’s a basis point drag on franchisee margin that compounds quietly over multiple quarters.
>
My 28-year read on this setup: the 19.1x TTM P/E on a capital-light franchise model with a demonstrable traffic recovery narrative and a management team that has correctly identified order count as its growth anchor is not expensive. The risk is franchise system health — always has been for asset-light models. Manage that variable, and the re-rating story is intact. Let it deteriorate, and no amount of lava cake launches will cover the gap.
—
Frequently Asked Questions
What does DPZ do?
Domino’s Pizza, Inc. (DPZ) is the world’s largest pizza company by global retail sales, operating primarily as a franchisor of pizza delivery and carryout restaurants. The company generates revenue through a capital-light franchise model, collecting royalties and fees from its extensive network of franchisee-operated stores across the United States and in more than 90 international markets. Domino’s also operates company-owned supply chain centers that manufacture and distribute dough, equipment, and supplies to franchisees, providing an additional revenue stream with meaningful scale advantages. As of 2026, the company’s model is anchored around digital ordering platforms, delivery logistics, and value-driven menu innovation designed to maximize order frequency and system-wide sales volume.
—
Why did DPZ miss EPS estimates in Q2 2026 despite strong demand?
The $0.10 EPS miss — $4.07 actual versus the $4.17 consensus — appears to reflect cost-side pressure at the franchisee and corporate level rather than a demand-side failure. Input cost inflation in key commodities, combined with labor cost step-ups in high-minimum-wage U.S. markets, created margin compression that offset otherwise healthy top-line momentum. The demand signal, as evidenced by management’s emphasis on order count growth, remained constructive — but translating traffic into clean earnings beats requires franchisee-level cost structures to cooperate, and in Q2 2026, they did not fully cooperate.
—
What is the significance of DPZ’s 19.1x P/E ratio in the current 2026 macro environment?
A 19.1x TTM P/E for a capital-light QSR franchise operator is arguably undemanding in a 2026 market environment where consumer resilience in the value segment is being re-priced upward. Relative to consumer discretionary peers carrying 24–28x multiples on less predictable earnings streams, Domino’s royalty-heavy revenue model — which produces high-margin, recurring cash flows — arguably deserves a premium rather than a discount. The current valuation implies the market is pricing in continued franchise system risk, which creates a potential re-rating opportunity if H2 2026 unit economics data comes in ahead of expectations.
Is the Q3 2026 EPS estimate of $4.37 achievable given current franchise challenges?
The $4.37 Q3 2026 consensus EPS estimate represents approximately a 7.4% sequential step-up from the Q2 actual of $4.07 — an ambitious but not implausible bar if two conditions hold. First, order count momentum — management’s stated primary growth lever — needs to continue inflecting positively, supported by value-oriented promotions and digital ordering penetration gains. Second, commodity input costs, particularly cheese and wheat derivatives, would need to stabilize or modestly ease on a quarter-over-quarter basis. TD Cowen’s traffic growth thesis supports the demand side of that equation; the franchise cost structure remains the variable that could disappoint or positively surprise relative to the $4.37 target.
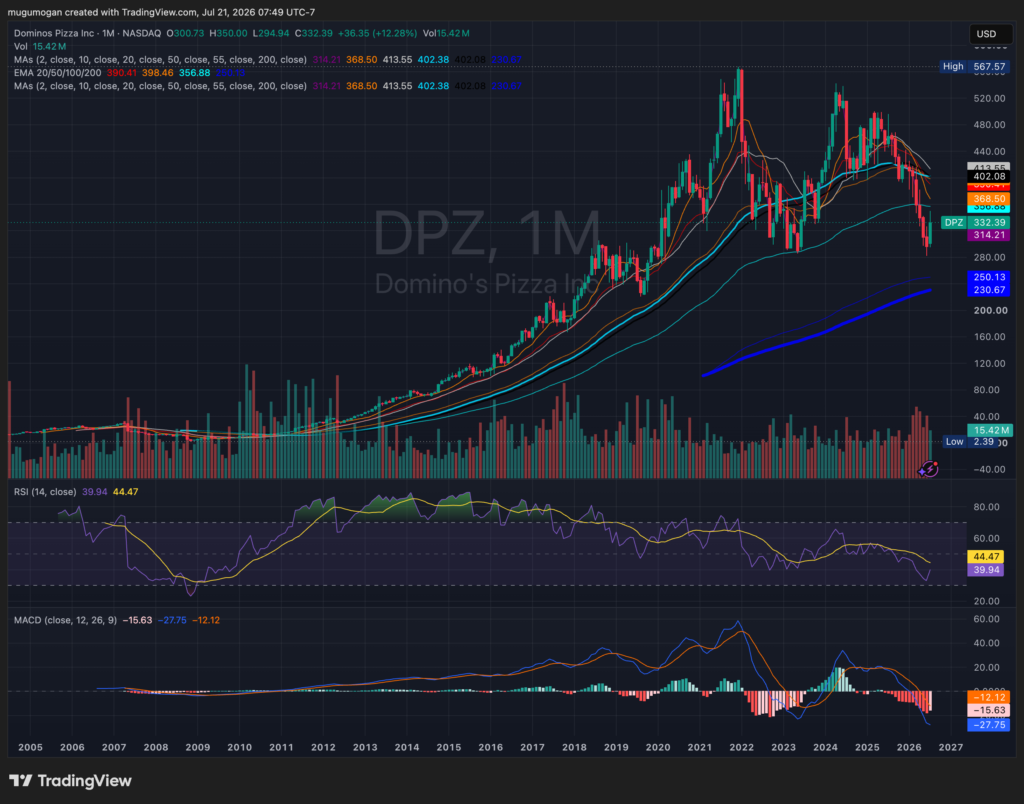
DPZ is in a confirmed long-term correction, trading below all key moving averages after losing multi-year support, with the primary trend having shifted from bullish to bearish. RSI is near 40, indicating weak momentum but not yet deeply oversold, while the MACD remains negative and continues to confirm downside momentum. A sustained move back above $365–390 would be the first sign of stabilization, whereas holding $300–315 is critical to prevent the longer-term downtrend from extending.