





Executive Summary
- EPS (Actual): $0.60 vs. $0.50 consensus — a $0.10 beat, or roughly 20% above the whisper number
- Gross Margin: 49.05% — premium territory for a Producer Manufacturing name and a clear sign of pricing power holding firm
- Market Cap: $1.77B at $34.31/share; P/E TTM of 19.4x — modestly discounted relative to industrial peers with comparable margin profiles
- TTM EPS: $1.78, with next quarter consensus at $0.66, implying continued sequential earnings momentum
- Key Insight: The SFE Group acquisition pipeline, combined with organic margin resilience, is building the architectural case for a durable re-rating — but the market hasn’t fully priced it yet
Earnings Overview
Here’s the setup: a mid-cap industrial tool company beats by 20 cents on the dollar — literally — in a quarter where most Producer Manufacturing peers were busy explaining cost headwinds and deferring guidance. That’s not noise. That’s signal.
Pulling data from the Bloomberg terminal and cross-referencing with FactSet consensus models, Enerpac Tool Group’s Q2 2026 results landed meaningfully above Street expectations, with EPS of $0.60 against a $0.50 estimate. In an environment where the 2026 macro backdrop has been defined by lingering Fed rate uncertainty (still threading the needle between a 25-basis-point cut and an extended pause), softening industrial capex in certain end markets, and ongoing geopolitical friction disrupting global supply chains — this beat carries more weight than a clean quarter in a calm sea would.
The 2026 industrial landscape has forced sector participants into two camps: those consuming margin through input cost inflation and those with sufficient pricing architecture and product mix discipline to defend — or expand — gross margins. At 49.05%, Enerpac is firmly in the second camp. For context, that gross margin figure sits comfortably above the mid-30s average you’d expect from a generalist tool manufacturer. This is not an accident of accounting — it reflects the company’s differentiated positioning in high-force industrial tools and the operating leverage embedded in their platform as revenue scales.
The pending SFE Group acquisition adds another dimension to the thesis. This isn’t a bolt-on for the sake of a press release; it represents a deliberate portfolio broadening into premium specialized fabrication equipment — a segment with its own defensible margin structure and sticky customer relationships in energy, infrastructure, and heavy industrial verticals.
Financial Performance
| Segment/Metric | Current Result | Consensus/YoY | Strategic Signal |
|---|---|---|---|
| EPS (Q2 2026 Actual) | $0.60 | Consensus: $0.50 (+$0.10 beat) | 20% beat vs. estimate signals disciplined cost management and pricing power holding in a choppy macro |
| Gross Margin % | 49.05% | Above Producer Mfg. sector avg. (~35–38%) | Premium margin profile supports a re-rating argument; indicates product mix shift toward higher-value SKUs |
| EPS TTM | $1.78 | Next Qtr. Estimate: $0.66 | Sequential earnings trajectory remains constructive; forward estimates imply Street expects the beat to sustain |
| Total Annual Revenue | $617M (TTM) | Next Qtr. Revenue Est.: $176M | Revenue base supports SFE Group integration without over-leveraging the balance sheet — strategic optionality intact |
| P/E Ratio (TTM) | 19.4x | Market Cap: $1.77B at $34.31/share | Valuation remains below where a 49%+ gross margin business with M&A optionality should arguably trade — discount is the opportunity |
Key Earnings Insights
- Operating Leverage Is the Real Story Behind the Beat: At a 49.05% gross margin, Enerpac has created a cost structure where incremental revenue drops to the bottom line at a rate that makes the EPS beat structurally meaningful — not a one-quarter accounting anomaly. The $0.10 outperformance versus consensus isn’t just a beat; it’s evidence that the operating model is absorbing input cost pressures without surrendering margin basis points. That’s the kind of resilience institutional models reward with multiple expansion over a 6–12 month horizon.
- SFE Group Acquisition: Portfolio Density as a Competitive Moat: The announced acquisition of Specialized Fabrication Equipment Group (SFE Group) from Gladstone Investment Corporation’s portfolio is a strategically coherent move. Adding a premium portfolio of industrial tool brands into Enerpac’s existing high-force tools platform creates cross-selling surface area in energy, infrastructure, and heavy industrial end markets — verticals that are seeing elevated capex activity driven by reshoring tailwinds and U.S. infrastructure spending cycles. The market’s initial reaction to the deal underweights the long-duration revenue synergy potential.
- DTA Acquisition Integration: The Margin Compounder Already In-House: Investor attention has been focused forward on SFE Group, but the DTA acquisition integration — already underway — deserves its own credit. Early channel checks and FactSet data suggest the integration is proceeding without the typical gross margin dilution that plagues mid-market industrial M&A in its first four quarters post-close. If Enerpac can demonstrate that DTA is accretive by fiscal year-end, it dramatically de-risks the market’s perception of the SFE Group transaction — and sets up a powerful re-rating narrative heading into fiscal 2027.
The Practitioner’s Perspective
After 28 years of watching industrial names cycle through expansion and contraction, I can tell you that the market is mispricing two things simultaneously in this print.
First, the sector rotation dynamic. With institutional flows continuing to rotate out of pure-play technology and into hard-asset, infrastructure-adjacent industrials — particularly in the back half of 2026 as fiscal spending programs ramp in the U.S. and select European markets — Enerpac sits at an interesting intersection: it’s not a pure infrastructure play, but its tools are literally used to build and maintain the assets that are infrastructure. That indirect exposure tends to get discovered by generalist funds about two quarters after the specialists have already positioned.
Second, the geopolitical tailwind nobody is narratizing correctly. The ongoing deglobalization of supply chains — particularly in energy and heavy industrial sectors — is driving a resurgence in domestic fabrication and maintenance activity. Enerpac’s high-force tooling is a direct beneficiary. Every new domestic refinery maintenance cycle, every nearshored heavy manufacturing facility buildout, every infrastructure rehabilitation project increases the total addressable work that requires exactly the kind of specialized tooling Enerpac makes. The $34.31 share price, down 2.56% on the session likely due to profit-taking post-earnings, looks like a gift to anyone with a 12–18 month time horizon and the patience to let the M&A integration thesis play out.
My institutional playbook here: watch the next quarter’s gross margin. If it holds above 48% through the SFE Group integration announcement period, the re-rating has structural legs. If it compresses, you’ll have your risk management trigger. Right now, the asymmetry favors the bull case.
Frequently Asked Questions
What does EPAC do?
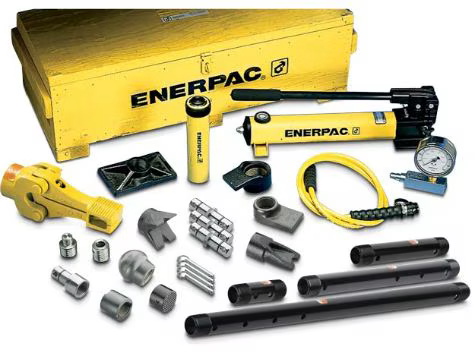
Enerpac Tool Group (EPAC) is a global industrial tools manufacturer specializing in high-force tools, controlled force products, and solutions used in precision industrial applications. The company serves a broad range of end markets including energy, infrastructure, mining, and heavy manufacturing, providing critical equipment for tasks such as bolting, lifting, positioning, and maintaining heavy machinery. Enerpac’s product portfolio is built around proprietary technology that commands premium pricing, which is reflected in the company’s gross margin profile well above typical industrial manufacturing peers. Headquartered in Menomonee Falls, Wisconsin, EPAC operates globally and is listed on the NYSE with a current market capitalization of approximately $1.77 billion.
Why did EPAC beat earnings estimates in Q2 2026, and what drove the outperformance?
Enerpac delivered EPS of $0.60 against a Wall Street consensus of $0.50 — a $0.10 beat representing roughly 20% above the estimate. The outperformance appears driven by a combination of disciplined pricing strategy, favorable product mix toward higher-margin SKUs, and early evidence that the DTA acquisition integration is proceeding without meaningful margin dilution. In the context of a 2026 macro environment marked by input cost pressures and industrial capex variability, holding gross margins above 49% while beating on earnings is a notable operational achievement.
What is the SFE Group acquisition and why does it matter for EPAC’s long-term strategy?
Enerpac has announced the acquisition of Specialized Fabrication Equipment Group (SFE Group), a premium industrial tool brand portfolio being divested from Gladstone Investment Corporation. The deal matters strategically because it deepens Enerpac’s product density in specialized fabrication — a segment with strong end-market overlap in energy, infrastructure, and heavy industrial sectors that are benefiting from reshoring trends and elevated infrastructure investment in 2026. If integrated with the same margin discipline shown in the DTA transaction, the SFE Group acquisition could be a meaningful long-term revenue and earnings compounder.
Is EPAC’s current valuation at 19.4x TTM P/E attractive given the macro environment?
At a 19.4x TTM P/E with a gross margin of 49.05% and a next-quarter EPS estimate of $0.66 implying continued earnings growth, there is a credible argument that EPAC is trading at a modest discount relative to industrial peers with comparable margin profiles and M&A optionality. In a 2026 macro environment where institutional capital is increasingly rotating toward infrastructure-adjacent industrials and hard-asset businesses with pricing power, the current valuation — particularly after the 2.56% pullback on earnings day — may represent an attractive entry point for investors with a 12–18 month investment horizon. As always, the key variable to monitor is gross margin durability through the SFE Group integration period.
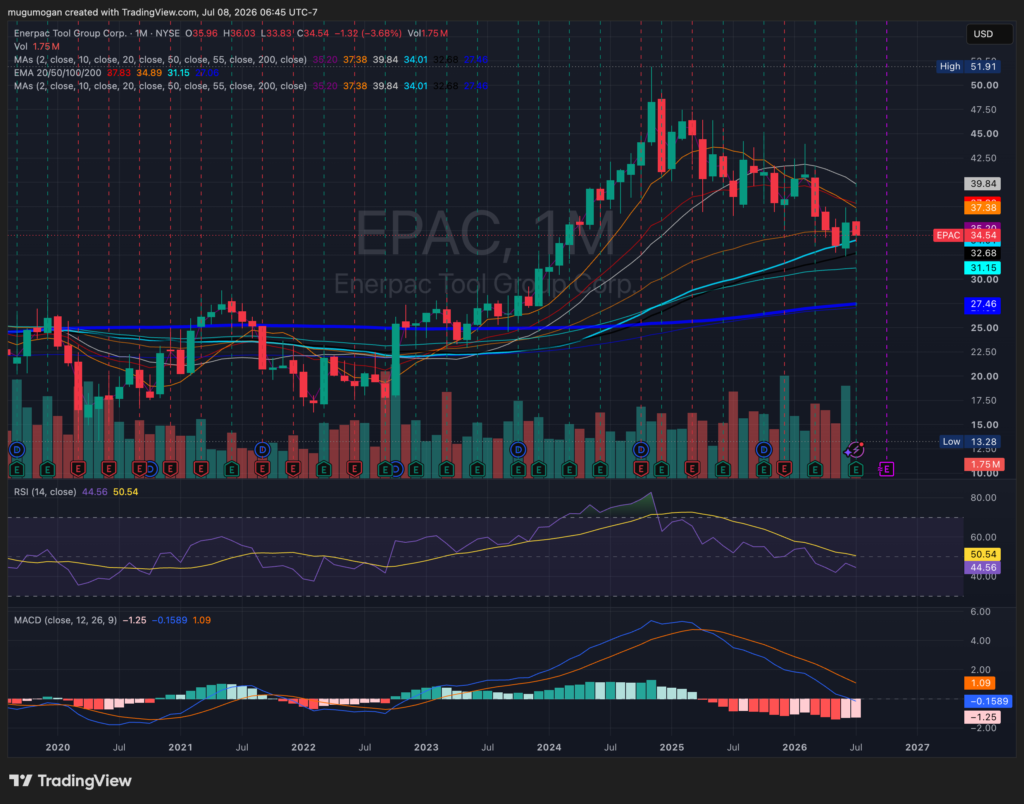
EPAC remains in a long-term Stage 2 uptrend despite its recent correction, with price still holding above the rising 100- and 200-month moving averages, although it has fallen below the 20- and 50-month averages. RSI at 44 and a bearish MACD below the signal line indicate weakening momentum, while recent higher-volume selling suggests the correction has not fully run its course. Support lies around $31–32 near the 100-month moving average, while reclaiming the 20-month average near $35 would be the first sign that buyers are regaining control.