Carnival Corporation & plc is the world’s largest cruise operator, controlling ~45% of global cruise capacity across brands like Carnival Cruise Line, Princess Cruises, and Holland America Line. The company operates over 90 ships serving ~700+ ports globally, targeting mass-market, premium, and luxury segments. Its business model is highly fixed-cost, meaning profitability swings dramatically with occupancy and pricing. Post-pandemic, Carnival has been in a multi-year recovery phase, focused on deleveraging and restoring margins. The stock is essentially a leveraged bet on global travel demand and consumer discretionary spending.
Carnival reported revenue of ~$5.4B (+15% YoY), beating analyst expectations by ~3–4%, driven by strong pricing and onboard spend. EPS came in at ~$0.35 vs expectations of ~$0.30, reflecting operating leverage kicking in. Net yields (pricing metric) grew ~8–9%, one of the strongest in the travel sector. The company guided FY2026 EBITDA higher, expecting continued yield growth and cost efficiencies. Forward bookings are at record levels with pricing above historical averages—translation: demand is not just back, it’s stronger.
History, Founding, and Business Model
Carnival was founded in 1972 by Ted Arison and is headquartered in Miami. It grew through aggressive acquisitions, including Princess Cruises and Costa Cruises, building a portfolio of brands targeting different customer segments. The company operates a multi-brand strategy—mass market (Carnival), premium (Princess), and luxury (Seabourn).
The cruise business is structurally unique: high upfront capex (ships cost $500M–$1B+) but strong incremental margins once ships are filled. Revenue is split between ticket sales (~65–70%) and onboard spending (~30–35%), which carries significantly higher margins.
Key competitors include Royal Caribbean Group and Norwegian Cruise Line Holdings, both of which have executed stronger balance sheet recoveries post-COVID.
Market Overview – Cruise Industry Growth
The global cruise market is expected to grow from ~$30B in 2023 to ~$55–60B by 2030, implying ~9–10% CAGR. Penetration remains low (~2–3% of global travelers), leaving room for long-term expansion. Demand is driven by experiential travel trends, aging populations with disposable income, and increasing middle-class wealth globally.
Cruises are also gaining share from traditional land-based vacations due to perceived “value per dollar” (bundled pricing). Carnival specifically benefits from being the low-cost leader, appealing to budget-conscious travelers—especially in a tightening macro environment.
Competitive Landscape
Carnival competes primarily with Royal Caribbean Group and Norwegian Cruise Line Holdings. Royal Caribbean has outperformed operationally with better margins and newer ships, while Norwegian focuses on premium pricing and smaller fleets.
Carnival’s weakness historically has been execution and balance sheet stress, but its strength is scale—larger fleet, broader segmentation, and stronger global distribution. If demand holds, scale becomes a margin weapon.
Unique Differentiation
Carnival’s core advantage is its portfolio + scale + cost leadership. It can target multiple customer segments simultaneously while maintaining lower operating costs per berth than peers.
Additionally, Carnival’s onboard monetization engine (casinos, drinks, excursions) is a hidden profit driver—these revenues can carry 50%+ margins. In a normalized environment, this creates significant operating leverage.
The flip side: heavy debt means equity holders are effectively leveraged bets on travel demand.
Management Team
- CEO: Josh Weinstein – Focused on yield growth, cost discipline, and deleveraging
- Chairman: Micky Arison – Long-time steward and son of founder
- CFO: David Bernstein – Leading capital structure optimization
Management’s credibility has improved post-2023 as execution has stabilized and guidance has consistently been met or exceeded.
Financial Performance (Last 5 Years)
Carnival’s revenue collapsed from ~$20.8B (2019) to near-zero during COVID, then rebounded to ~$21B+ run rate in 2025. That’s a full recovery, but with a very different balance sheet. Revenue CAGR (2019–2025 adjusted) is roughly flat, but trajectory is now strongly positive (~10–15% growth).
Profitability has lagged due to interest expense. Pre-COVID, Carnival generated ~$3B+ net income annually. Today, earnings are still recovering, with margins compressed by ~$30B+ in debt. EBITDA recovery is strong, but net income is still catching up.
Debt is the elephant: net debt ballooned from ~$11B (2019) to ~$30B+. Interest expense is now ~$2B+ annually—this is why the equity feels “heavy” despite strong demand.
Free cash flow is improving meaningfully, and deleveraging is the key narrative. If they execute, equity upside is significant; if not, you’re holding a leveraged travel ETF.
Bull Case
- Strong pricing power + record bookings → sustained yield expansion
- Operating leverage + deleveraging → EPS inflection over next 2–3 years
- Cruise penetration still low → long runway for secular growth
Bear Case
- $30B+ debt → limits equity upside and increases macro sensitivity
- Fuel costs + labor inflation could compress margins
- Any demand slowdown hits cruises first (discretionary luxury spend)
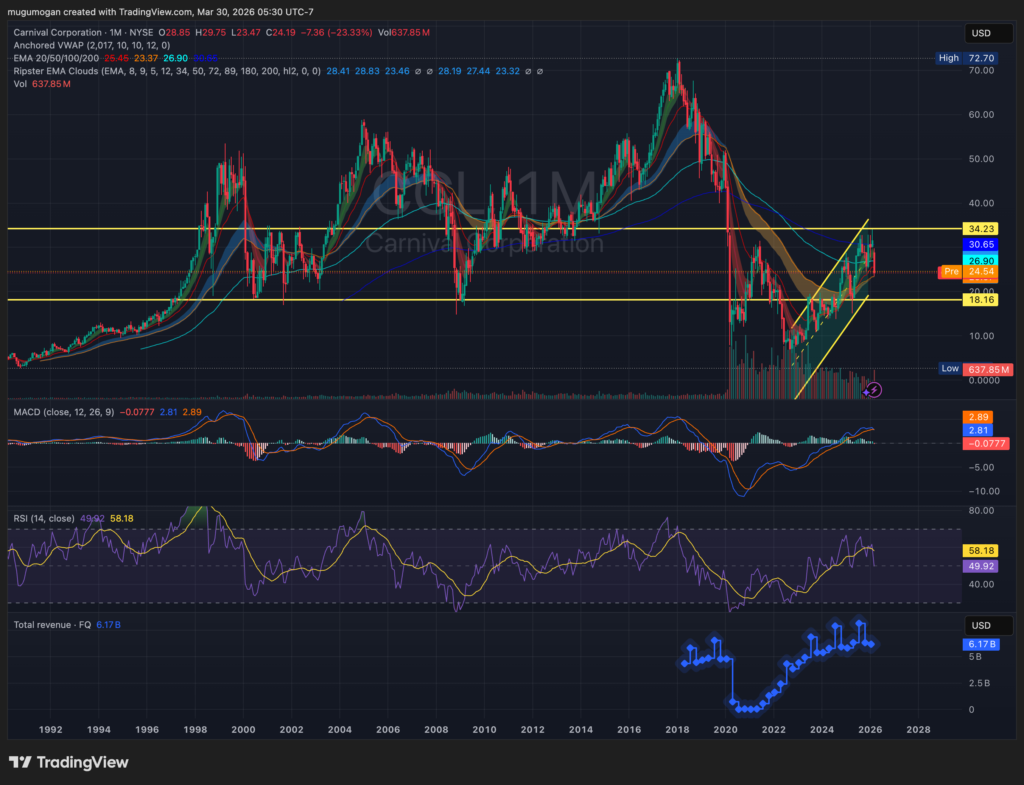
This is a clean recovery uptrend with higher lows and a clear ascending structure. Price is consolidating below major resistance at ~$34, which is the key breakout level. Momentum is positive but not overextended, suggesting accumulation rather than exhaustion. If it breaks $34 with volume, it likely runs toward $40+, but rejection could send it back to the $22–24 range while maintaining the uptrend. Overall: bullish structure, but still waiting for confirmation.