Company Overview — BlackRock at a glance
BlackRock (NYSE: BLK) is the world’s largest asset manager, running a multi-product platform across index ETFs (iShares), active strategies, cash management, alternatives, and technology services (notably Aladdin). It ended 2025 with about $14.04T in assets under management (AUM), with the business benefiting from both market appreciation and strong organic flows. BlackRock’s revenue base is diversified across management fees, performance fees, securities lending, and subscription-like technology revenue. Strategically, it is pushing hard into higher-fee private markets (infrastructure, private credit, data/analytics) to complement its scale in ETFs. In public comps, its closest “platform” peers are other large asset/asset-servicing firms like State Street and diversified public managers like T. Rowe Price and Invesco.

Most Recent Earnings — Q4 2025 and what mattered
BlackRock reported Q4 2025 (released January 15, 2026) results with total revenue of $7.008B vs $5.677B a year ago (about +23% YoY) and adjusted diluted EPS of $13.16 vs $11.93 (about +10% YoY). On an “as adjusted” basis, net income was $2.176B for the quarter. The headline story was a combination of (1) record AUM, (2) very large net flows, and (3) growing contribution from private markets and technology revenue, offset by higher expenses tied to acquisitions and compensation dynamics.
Guidance and 2026 outlook — what BlackRock is effectively “guiding”
BlackRock doesn’t typically give clean quarterly revenue guidance like a software company; the “guide” is more about drivers: market levels, fee rates, organic flows, and operating expense trajectory. Management framed 2026 as a year where the platform is broader than ever—public markets scale plus a bigger private-markets and data/tech stack—supported by recent acquisitions. The firm also highlighted capital return actions (dividend increase and buyback authorization) and communicated cost/organizational actions (including a modest headcount reduction) as it integrates acquisitions and focuses on operating leverage.
Founding and evolution — from bond shop to “global financial operating system”
BlackRock was founded in 1988 and built early credibility as a fixed-income risk manager before expanding into a global, multi-asset manager. Over decades it scaled via institutional mandates, distribution partnerships, and acquisitions that filled product gaps and extended reach. The firm’s long-running strategic advantage has been coupling investing with risk analytics—an operating model that became a commercial product as Aladdin expanded across the industry. By the 2010s–2020s, the combination of iShares ETF leadership and institutional solutions positioned BlackRock as the default “core allocation” provider for many large asset owners.
Products and business mix — where the revenue and stickiness come from
BlackRock’s economic engine is largely base management fees on massive AUM, with iShares providing scale and distribution, and active and alternatives adding higher-fee mix. Beyond asset management, technology services and subscription revenue (Aladdin and related offerings) has become a meaningful and growing contributor, with management calling out strong contract value growth. The firm also benefits from securities lending and episodic performance fees, with performance fees jumping meaningfully in the recent quarter, reflecting stronger results in certain strategies.
Acquisitions and platform expansion — why 2026 is about integration and margin mix
BlackRock has been building a “full-stack” investing platform: public markets (index + active), private markets (infrastructure/private credit), and data/analytics. Recent acquisitions (including infrastructure and data) are designed to raise fee mix, deepen institutional relationships, and create cross-sell between portfolio construction, private allocations, and analytics workflows. The practical 2026 question is execution: integrating teams, keeping client service tight, and converting platform breadth into sustained organic base-fee growth.
Market landscape — the business BlackRock is really in
Asset management is structurally driven by (1) global household and retirement wealth formation, (2) the shift from bank balance sheets to capital markets, and (3) the ongoing migration from higher-cost vehicles to lower-cost ETFs and model portfolios. At the same time, the fee pool is increasingly concentrated in “outcomes” and “alternatives”—private credit, infrastructure, and solutions that solve institutional problems rather than just providing beta. That creates a bifurcated market: scale wins in ETFs, but differentiated capability and distribution win in private markets and solutions.
Market growth to 2030 — what the data says and what it implies
Credible industry forecasts generally expect global AUM to continue expanding through 2030, supported by demographics, higher participation in capital markets, and growth in private assets. A mid-single-digit global AUM CAGR into 2030 is a reasonable baseline in many institutional outlooks, with upside/downside primarily tied to sustained market levels and the pace of private-market adoption. For BlackRock, the key isn’t just “AUM grows,” it’s whether the mix shifts toward higher-fee segments fast enough to offset ongoing fee compression in core beta products.
Competitive set — who BlackRock fights and where
In ETFs/index, the competitive gravity is scale and cost (with Vanguard as the private behemoth and State Street as a major public competitor). In active mutual funds and retirement channels, competitors include firms like T. Rowe Price and others with strong distribution. In alternatives, BlackRock competes more directly with private markets specialists and multi-alternative platforms (and increasingly with large insurance/credit managers) for fundraising, deal access, and performance. The competitive map changes by client: sovereigns and pensions care about solutions + risk + private-market access, while wealth channels care about model portfolios, brand trust, and distribution economics.
Differentiation — what BlackRock has that most peers don’t
BlackRock’s differentiation is the rare combination of (1) massive scale in low-cost beta (iShares), (2) an enterprise technology and risk platform (Aladdin + data), and (3) a growing private-markets footprint that can be packaged into “whole portfolio” solutions. That stack creates a flywheel: ETFs drive relationships and liquidity; analytics/risk tools deepen operating integration; private markets lift fees and embed long-duration client partnerships. Many peers have one or two of these legs; very few have all three at BlackRock’s scale.
Management — the 3 names that matter most
Larry Fink (CEO) remains the face of strategy and the institutional relationship network, especially around private markets and global allocation themes. Rob Kapito (President) is central to execution across the platform, distribution, and product breadth. Martin Small (CFO) is the key operator for 2026 integration economics—expense discipline, operating leverage, capital return, and how the company reports “as adjusted” results through acquisition-related complexity.
Financial performance (5 years) — revenues, earnings, and what’s actually happening
On a reported basis, BlackRock’s annual revenue has been volatile with markets but shows the scale trend: 2021 $19.374B → 2022 $17.873B → 2023 $17.859B → 2024 $20.407B → 2025 $24.216B. That’s a roughly ~5.7% revenue CAGR from 2021 to 2025 (with 2025 reflecting both stronger markets/flows and acquisition-related contributions). The biggest takeaway is operating leverage: in good tape + strong flows, revenue snaps back quickly, and the platform throws off significant earnings power.
Financial performance (5 years) — profitability, EPS path, and capital return signal
Net income over the same span shows the same market sensitivity plus acquisition/accounting noise: 2021 $5.901B → 2022 $5.178B → 2023 $5.502B → 2024 $6.369B → 2025 $5.553B. Diluted EPS (as reported in standardized financial tables) reads 2021 $38.22 → 2022 $33.97 → 2023 $36.51 → 2024 $42.01 → 2025 $35.31, with 2025 pressured by notable nonrecurring and acquisition-related items even as the business produced strong adjusted metrics in Q4. BlackRock also signaled confidence via continued shareholder returns (dividend increase and buyback authorization discussed alongside the earnings print), which matters because asset managers ultimately get valued on durable fee earnings plus capital return discipline.
Bull case and bear case — what makes BLK work (or not) from here
Bull case: BlackRock keeps compounding organic flows at scale while mix shifts toward higher-fee private markets and technology subscriptions, expanding earnings power even if ETF fees keep compressing; the private-markets fundraising target to 2030 becomes a credible, visible earnings growth driver; and the platform’s “operating system” advantage (distribution + Aladdin + solutions) keeps client switching costs high. Bear case: markets flatten or mean-revert and fee-related earnings power stalls; private markets integration and fundraising disappoint (or margins compress due to competition); and regulatory/political pressures plus fee compression keep a lid on operating leverage just as expenses rise with a larger platform.
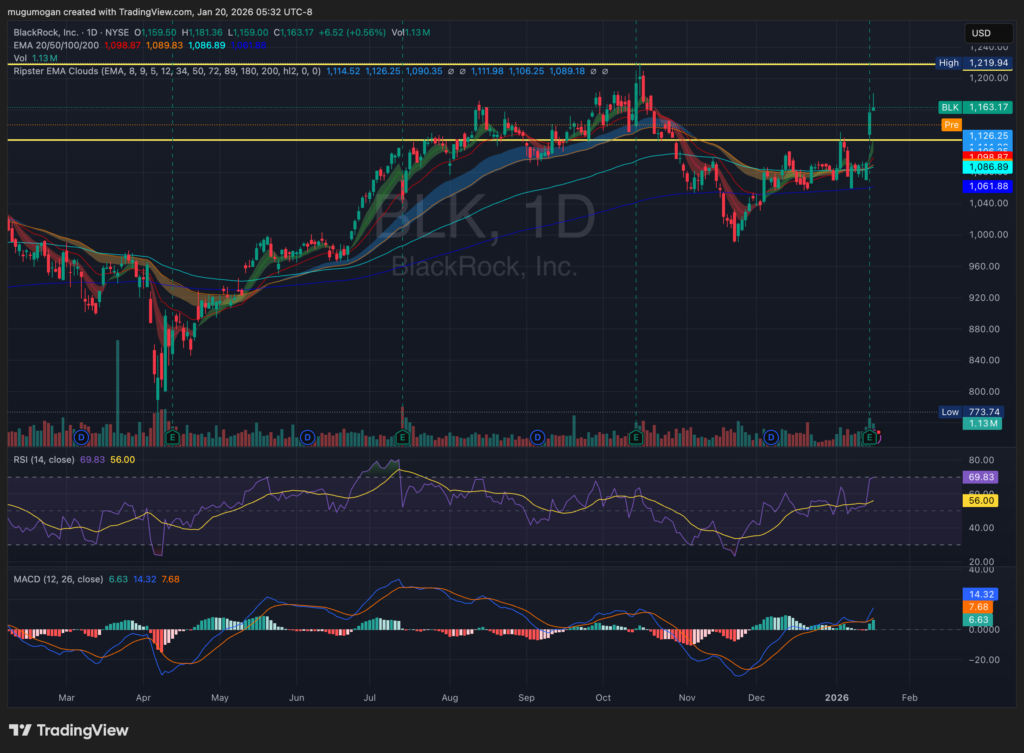
The stock is in a bullish stage 2 on the monthly and weekly charts. The daily chart shows a stage 2 move to the ATH at $1218 range, with support at $1211 range.